Strategies
You can initilize a strategy by Pine language.
Tradingview has a tab named Strategy Tester near the tab named Pine Editor that it has been created for backtesting your Pine scripts.
How to load indicators on your strategy
When you want to test your strategy on Tradingview, you have to start your Pine script with the method strategy.
//@version=4
strategy("My Simple Strategy Script", "", true) // in the main chart
And then, it is the same for loading your indicators.
A script runs either in overlay=true mode on the chart, in which case it cannot direct plots elsewhere, or in a separate pane when overlay=false (the default).
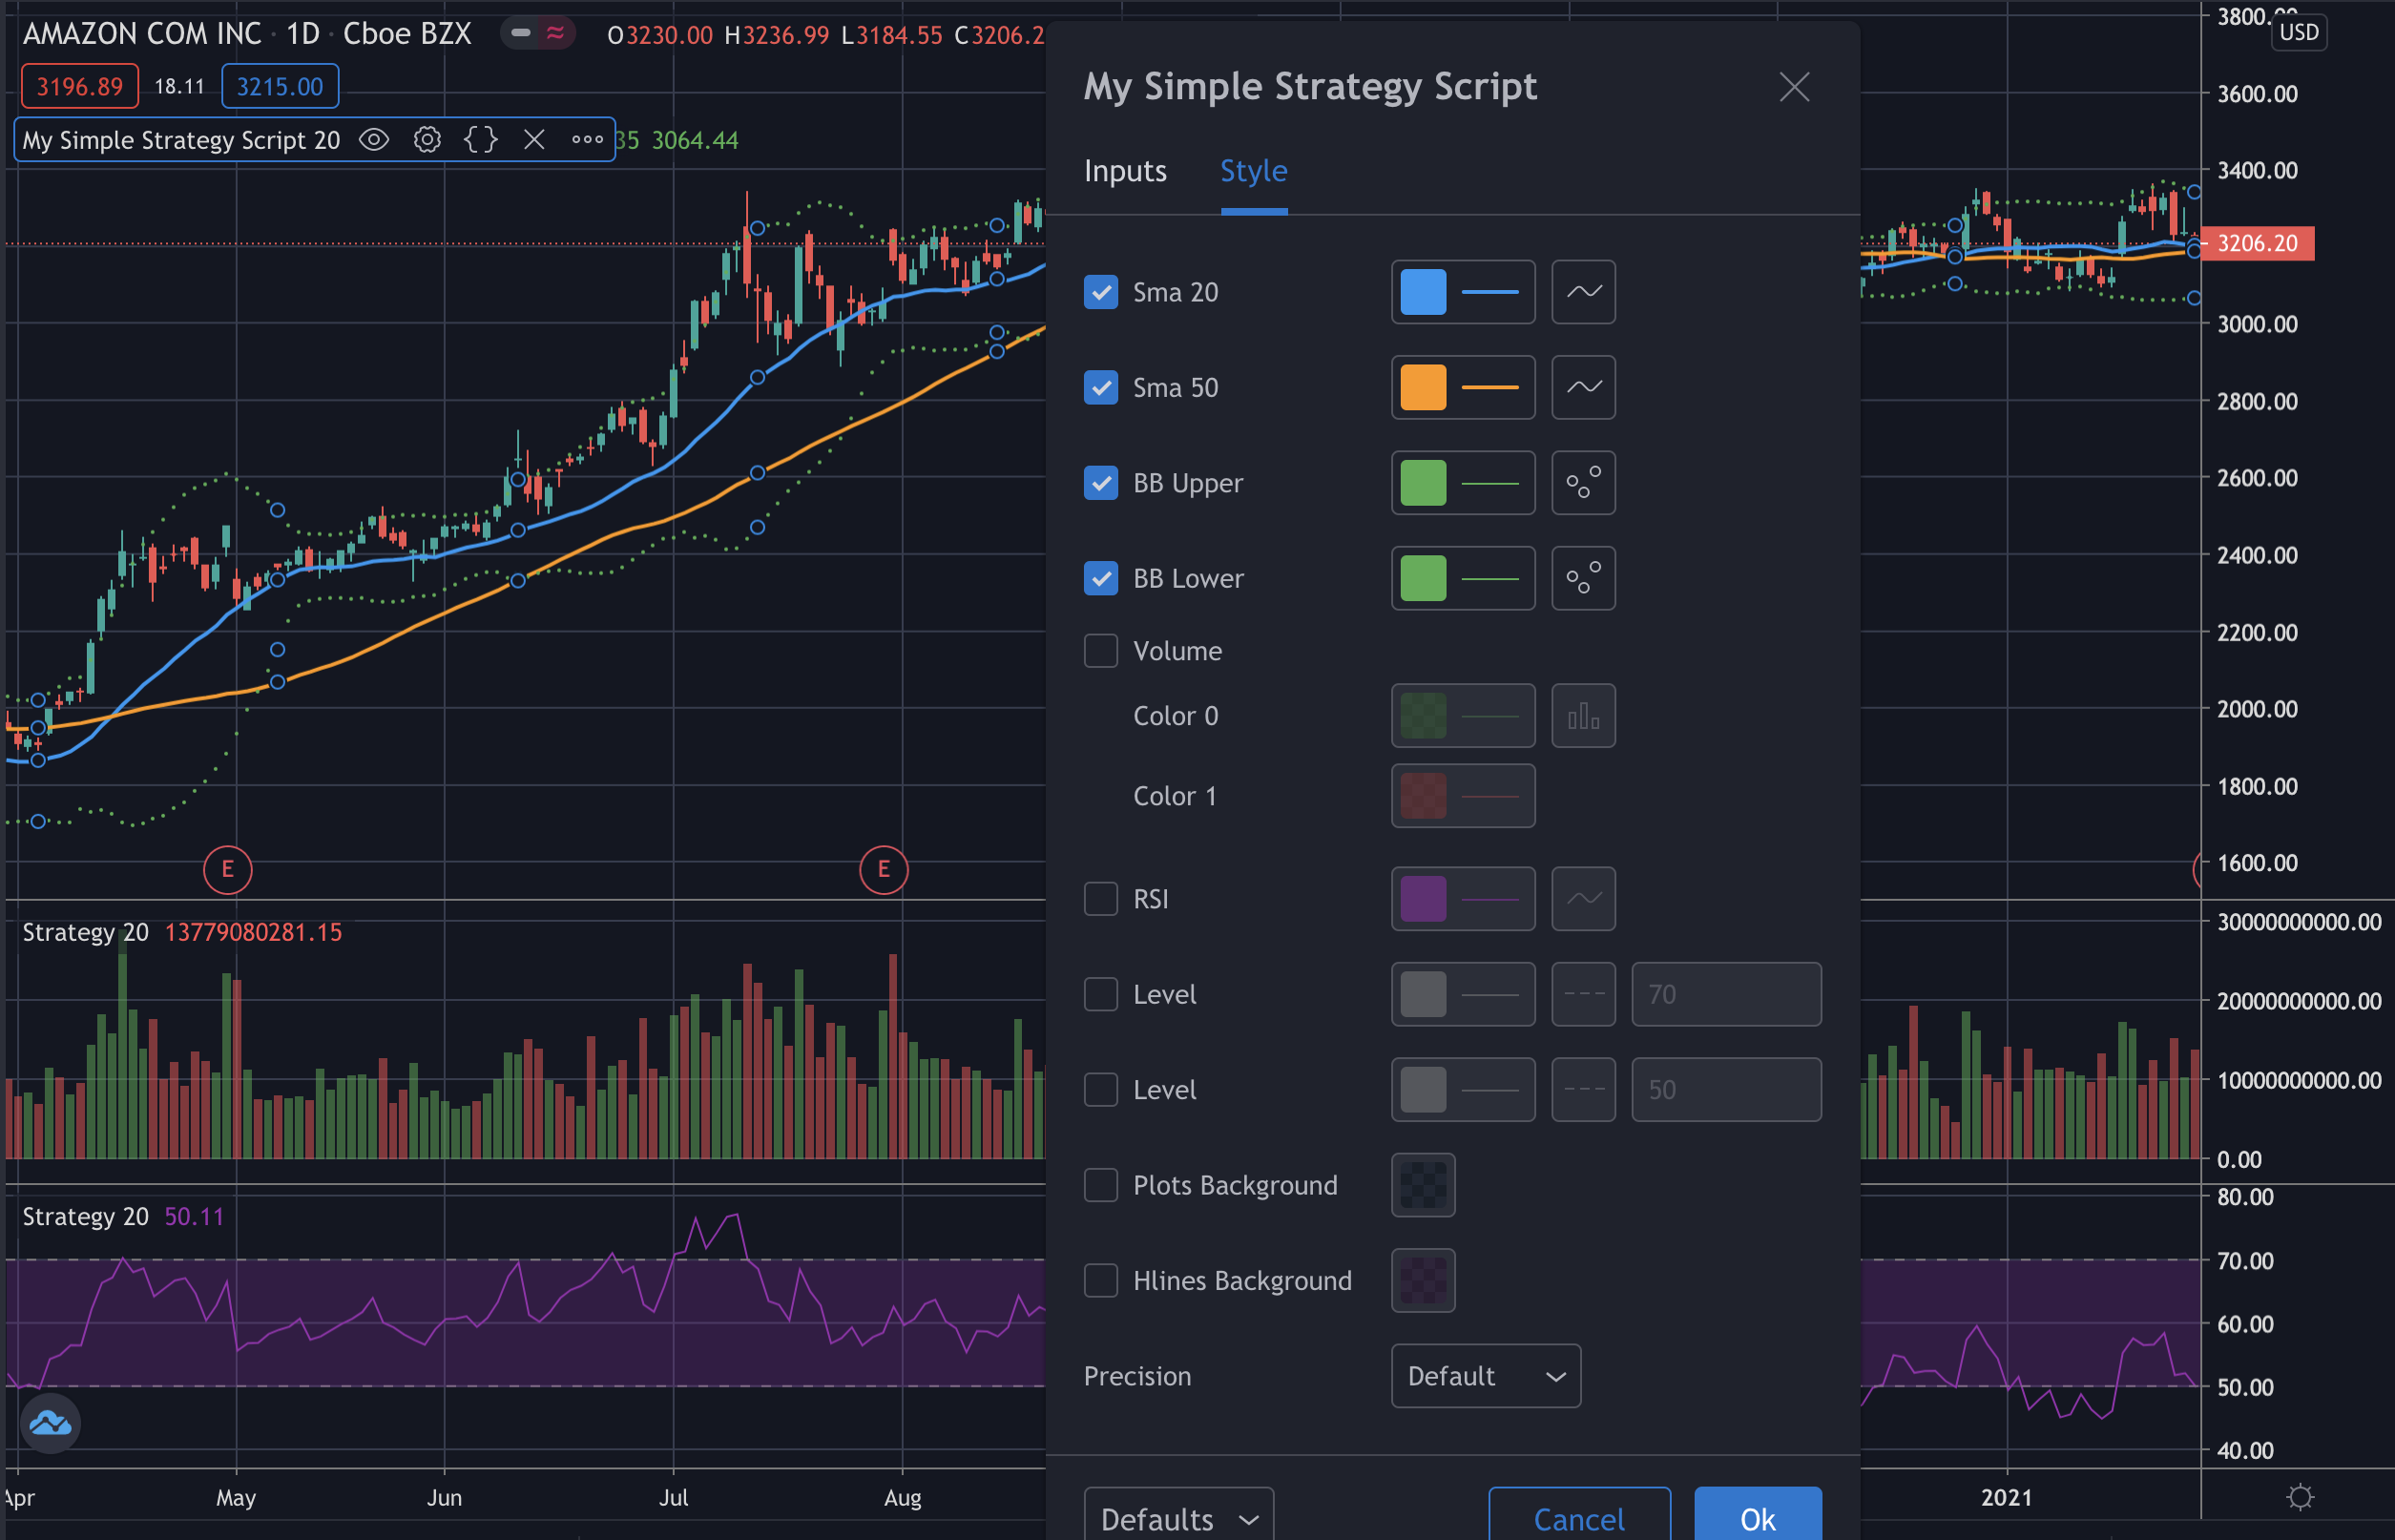
But there is a workaround for having some plots in the main chart and others in another chart. You can use Settings > Style for flagging who see where you want. So you can also add this code,
// initialization
legs = input(20)

// moving averages
sma20 = sma(close, legs)
plot(sma20, "sma 20", color.blue, 2)
plot(sma(close, 50), "sma 50", color.orange, 2)

// bollinger bands
dev = 2 * stdev(close, legs)
upper = sma20 + dev
lower = sma20 - dev
p1 = plot(upper, title="BB upper", color=color.green, linewidth=1, style=plot.style_circles)
p2 = plot(lower, title="BB lower", color=color.green, linewidth=1, style=plot.style_circles)
fill(p1, p2)

// volume
plot(volume * vwap, title="Volume", style=plot.style_columns, color=close >= open ? color.green : color.red, transp=50)

// rsi
plot(rsi(close, legs), title="RSI", color=color.purple)
h0 = hline(70)
h1 = hline(50)
fill(h0, h1, color=color.purple, transp=75)
Add the chart on the main chart with the header
//@version=4
strategy("My Simple Strategy Script", "", true) // in the main chart
Add the chart on another chart with the header
//@version=4
strategy("My Simple Strategy Script") // a chart space dedicated
And then you can use the Settings for splitting the plots between the main chart and others.
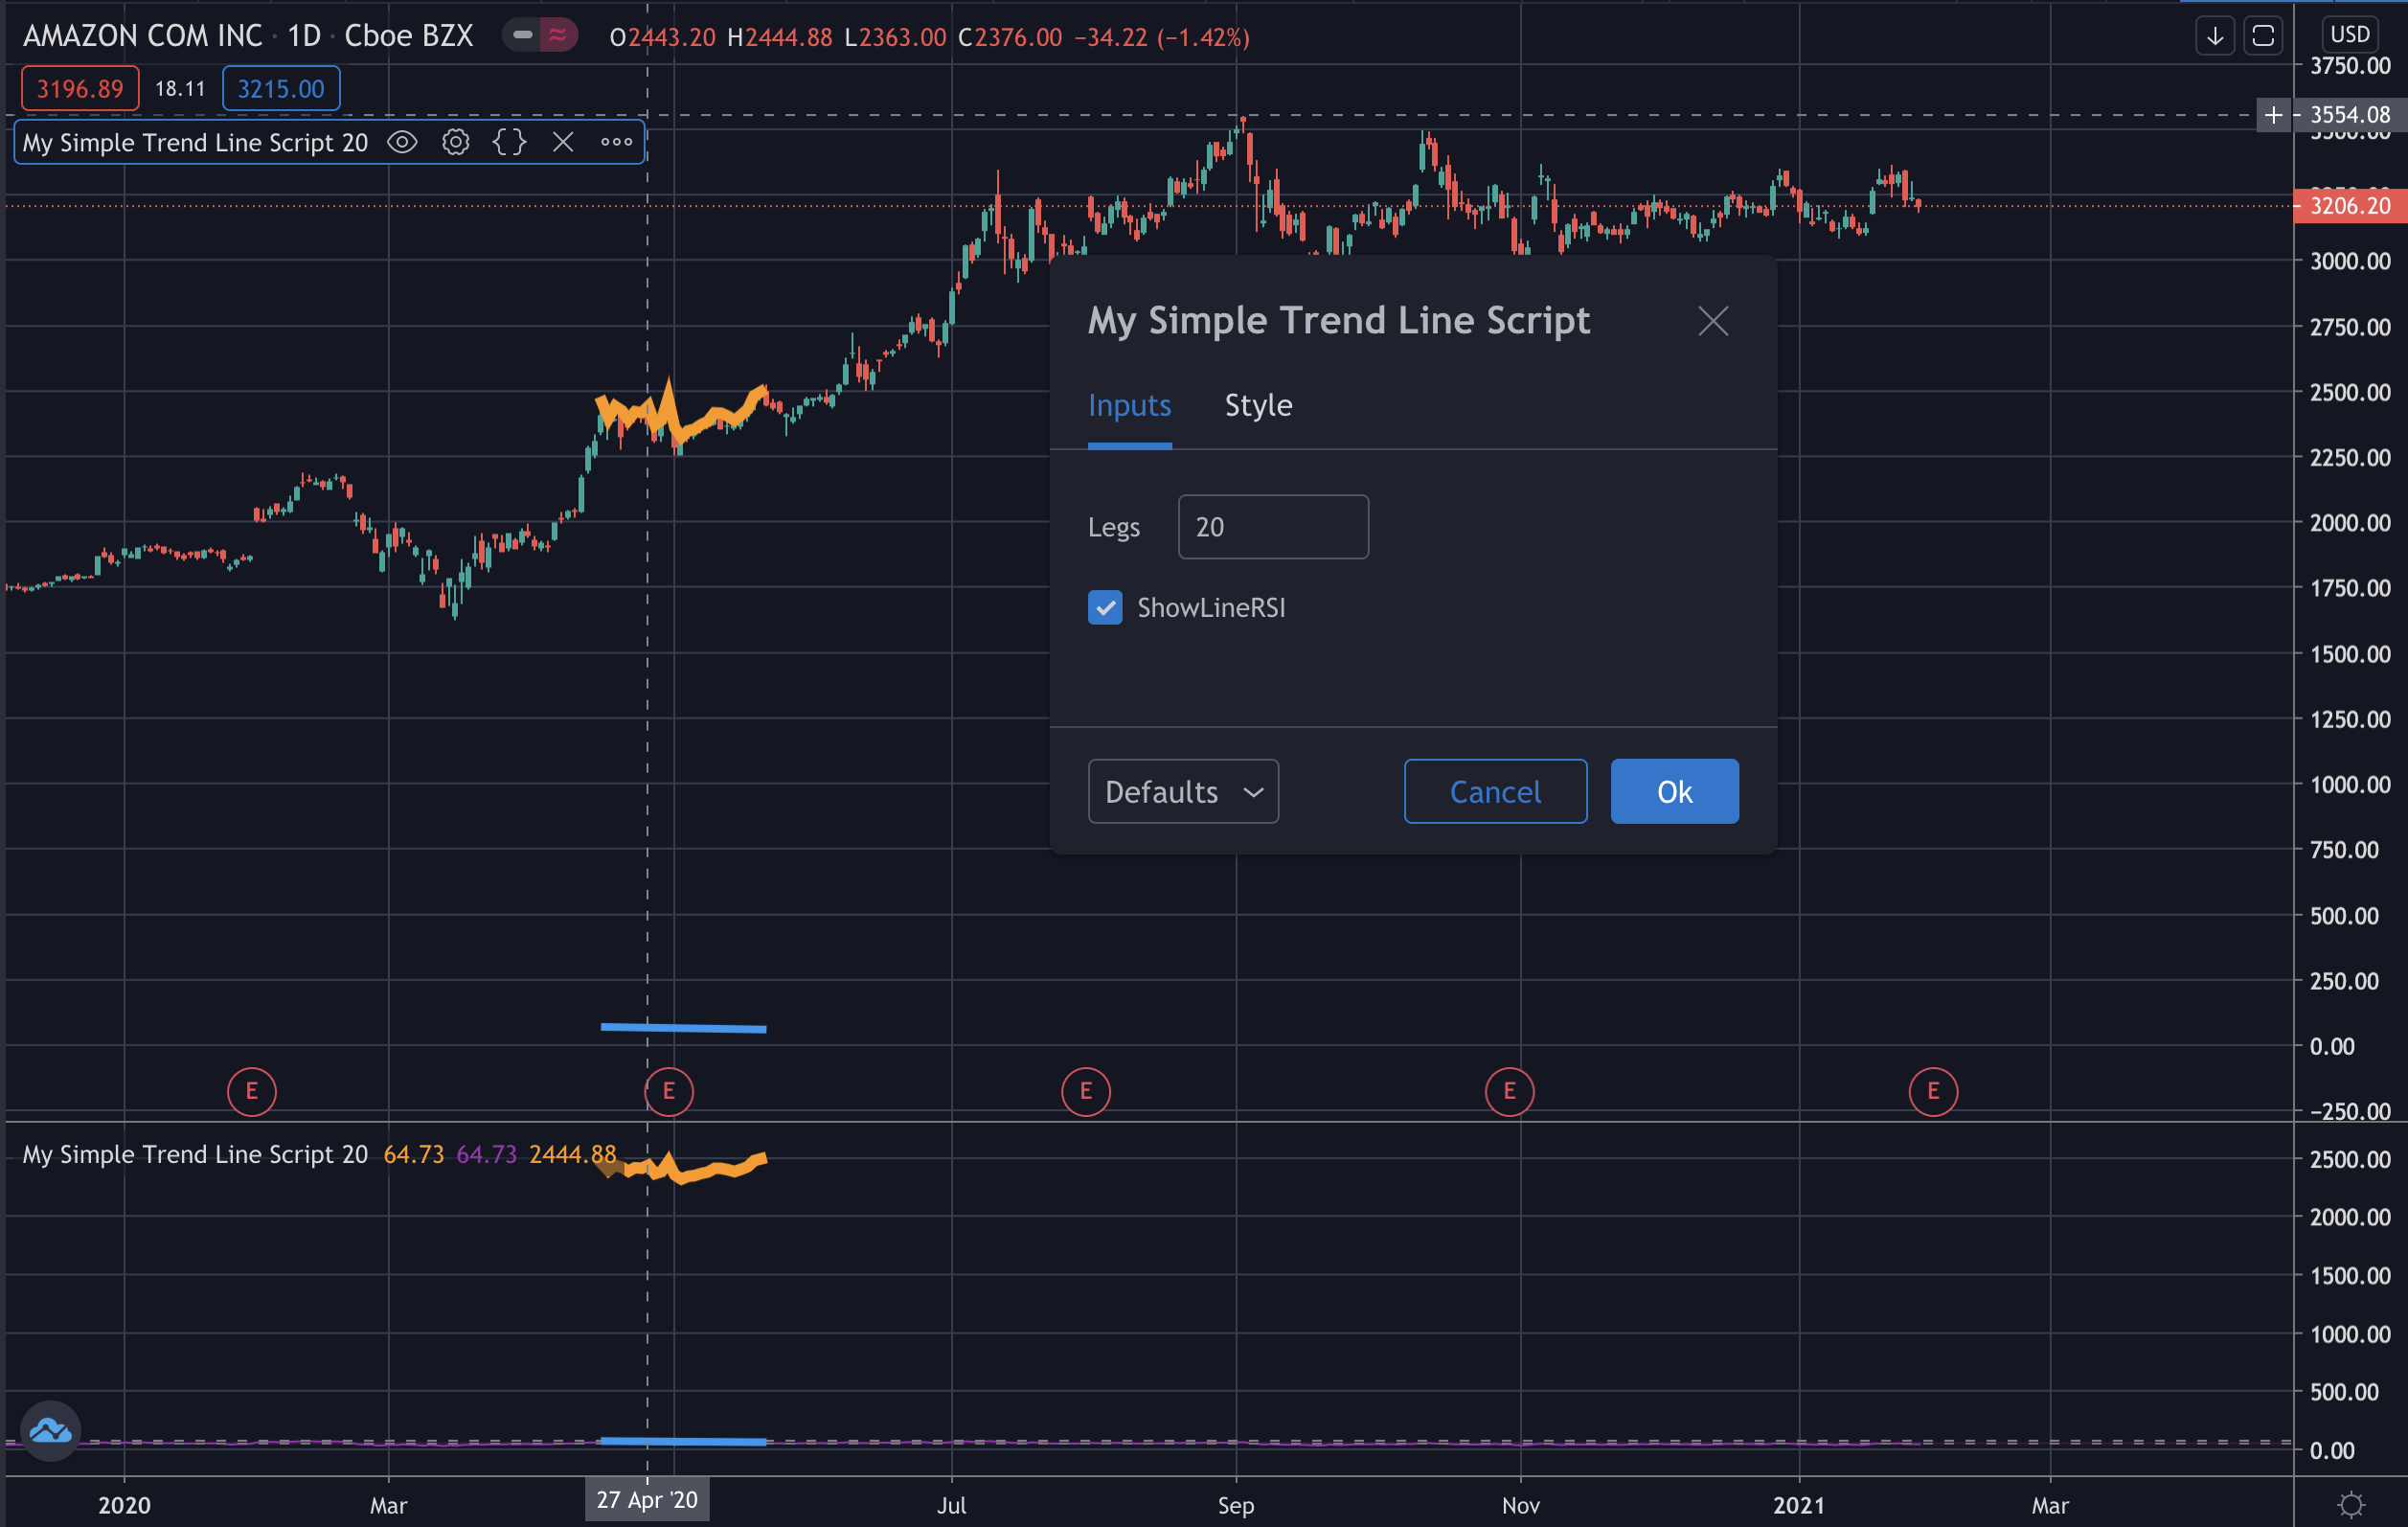
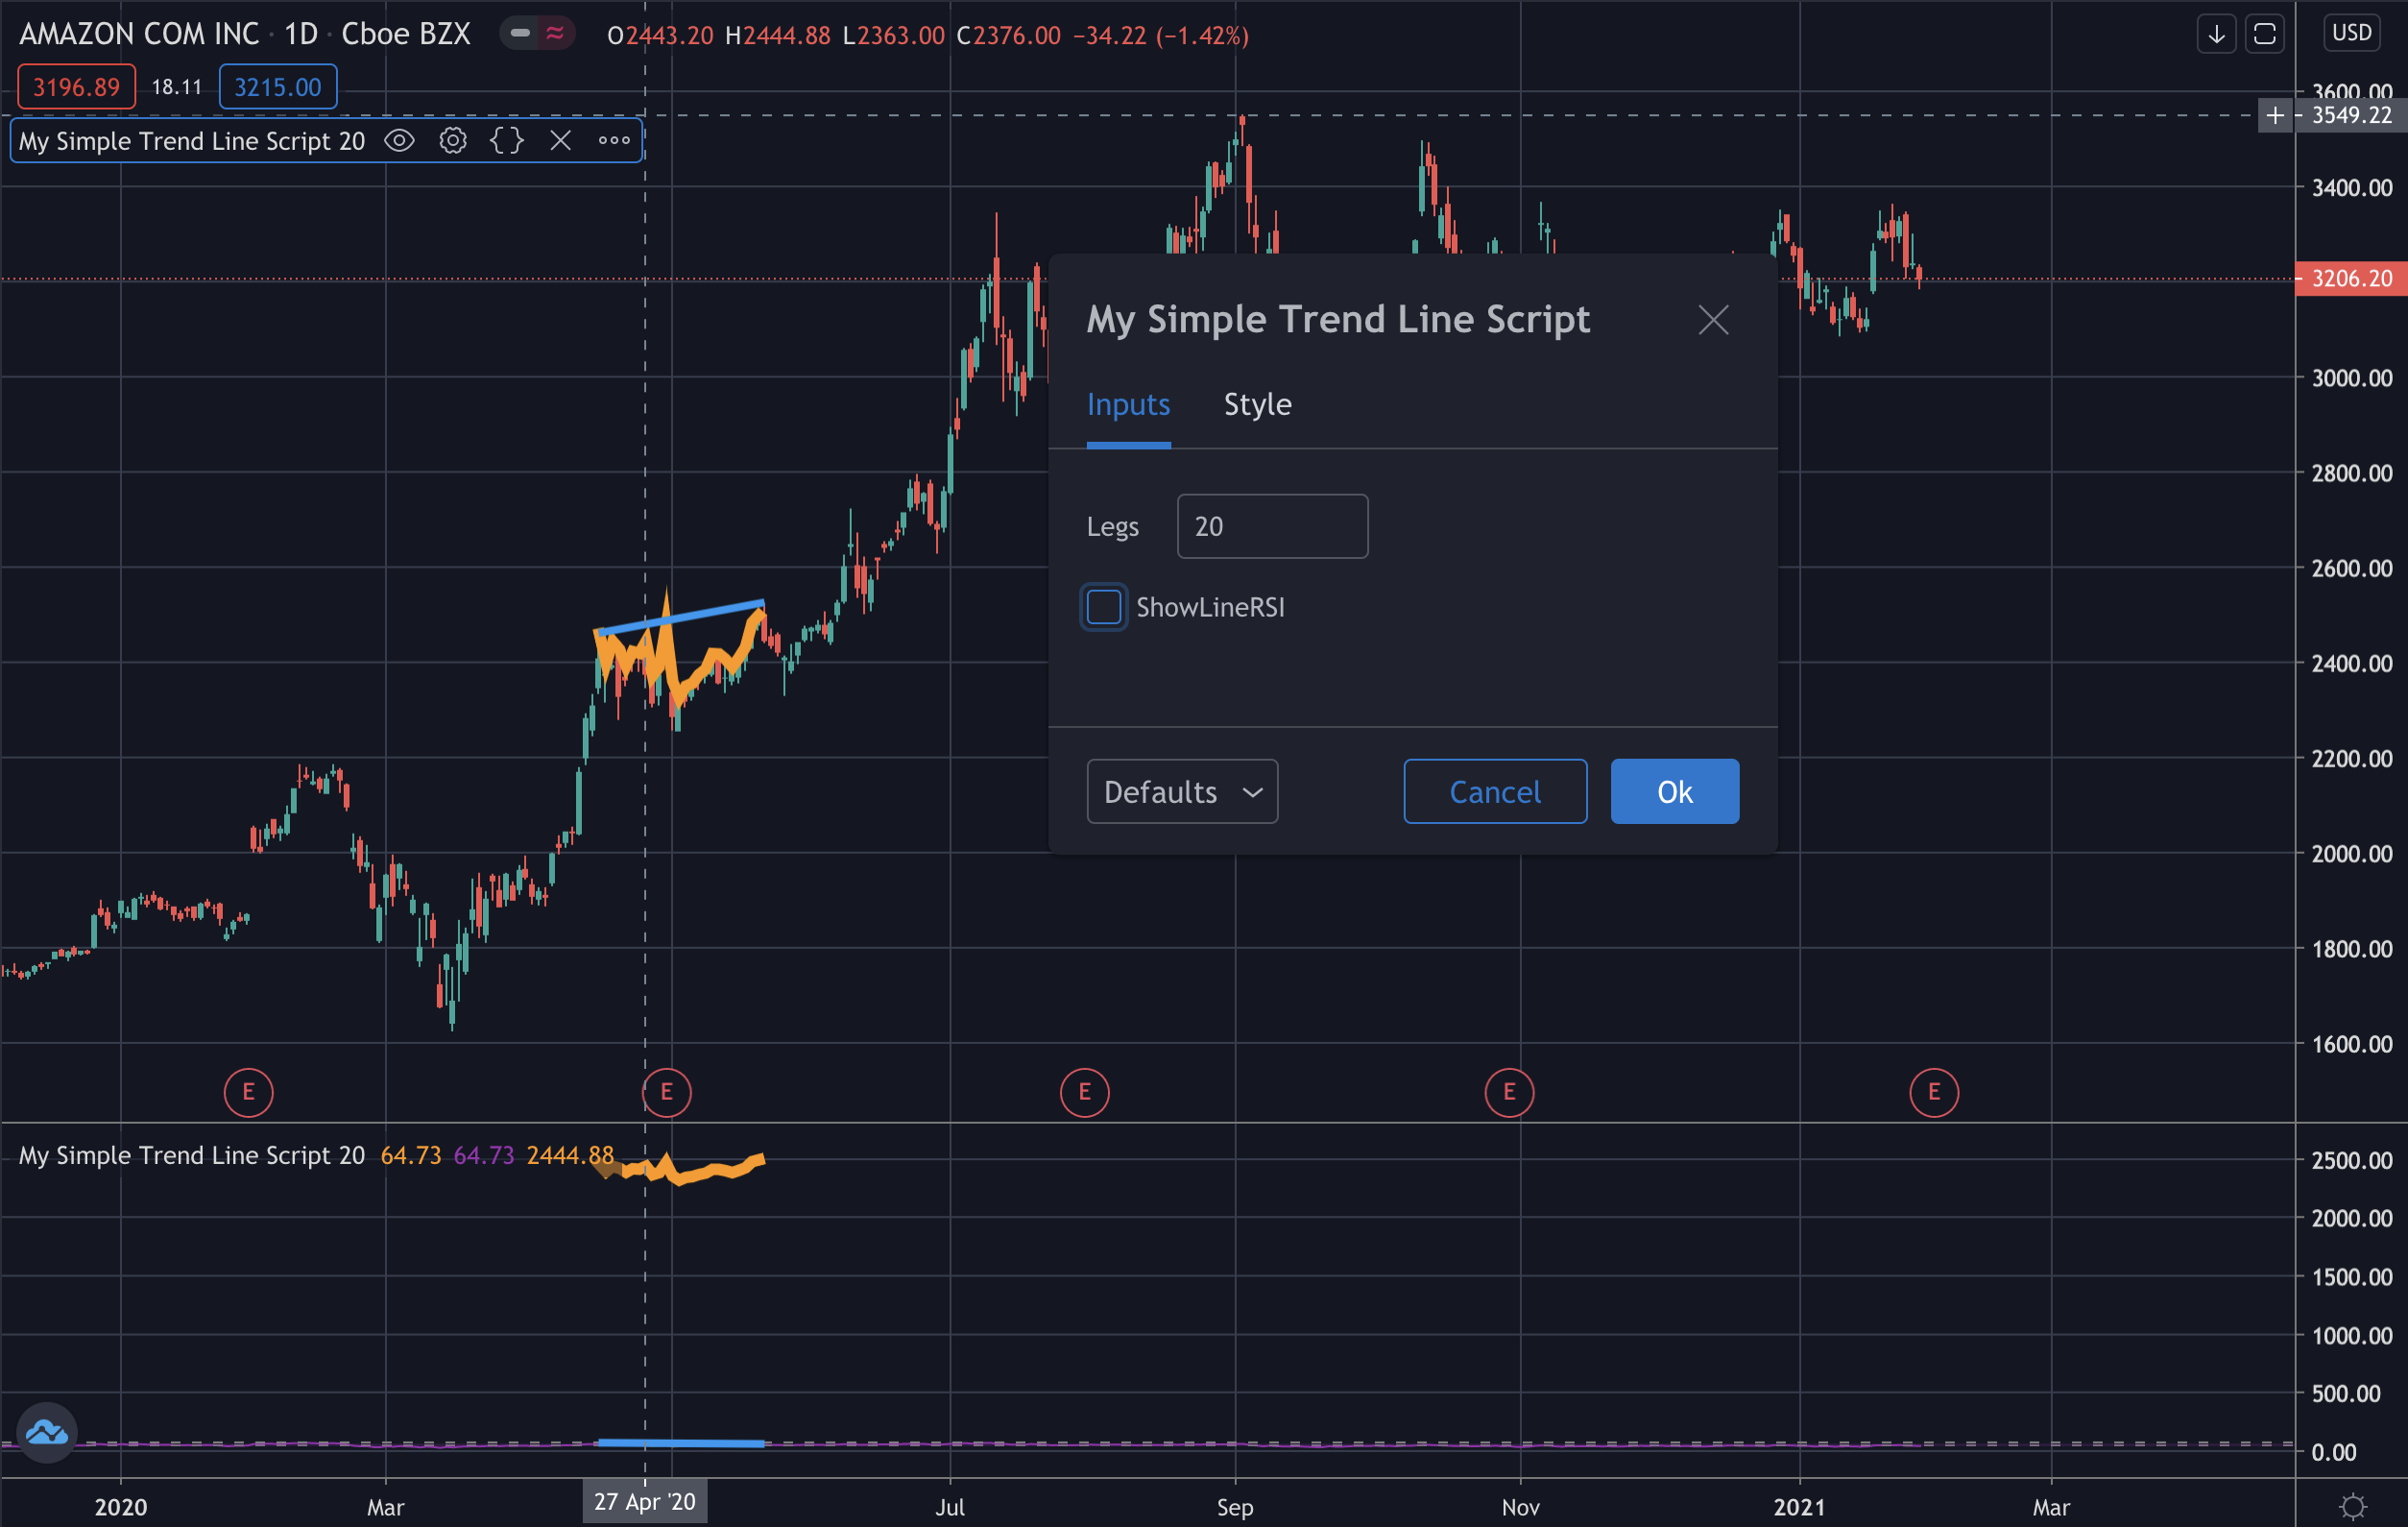
Instead, for the line method it is necessary to use an input and conditions for splitting the lines between the main chart and another. You can use Settings > Input for flagging who see where you want in order of the conditions.
In the code below is used the variable named showLineRSI for the visualization of the lines on RSI chart or the main chart.
// initialization
showLineRSI = input(true)

var bar_time1 = 0
var bar_time2 = 0
var float bar_high1 = 0
var float bar_high2 = 0
var float bar_rsi1 = 0
var float bar_rsi2 = 0
_rsi = rsi(close, 20)

if time == timestamp(2020, 04, 16, 09, 30)
    bar_high1 := high
    bar_time1 := time
    bar_rsi1 := _rsi

if time == timestamp(2020, 05, 21, 09, 30)
    bar_high2 := high
    bar_time2 := time
    bar_rsi2 := _rsi

// rsi line
plot(bar_rsi1 == 0 or bar_rsi2 != 0 ? na : _rsi, title="RSI of trend", color=color.orange, linewidth=2)
plot(rsi(close, 20), title="RSI", color=color.purple)
h0 = hline(70)
h1 = hline(50)
fill(h0, h1, color=color.purple, transp=75)

// rsi trend line
if bar_rsi1 != 0 and bar_rsi2 != 0 and showLineRSI
    line.new(bar_time2, bar_rsi2, bar_time1, bar_rsi1, xloc.bar_time, width = 4)
    bar_rsi1 := 0
    bar_rsi2 := 0

// high line
plot(bar_high1 == 0 or bar_high2 != 0 ? na : high, title="High line", color=color.orange, linewidth=6)

// high trend line
if bar_high1 != 0 and bar_high2 != 0 and showLineRSI != true
    line.new(bar_time2, bar_high2, bar_time1, bar_high1, xloc.bar_time, width = 4)
    bar_high1 := 0
    bar_high2 := 0
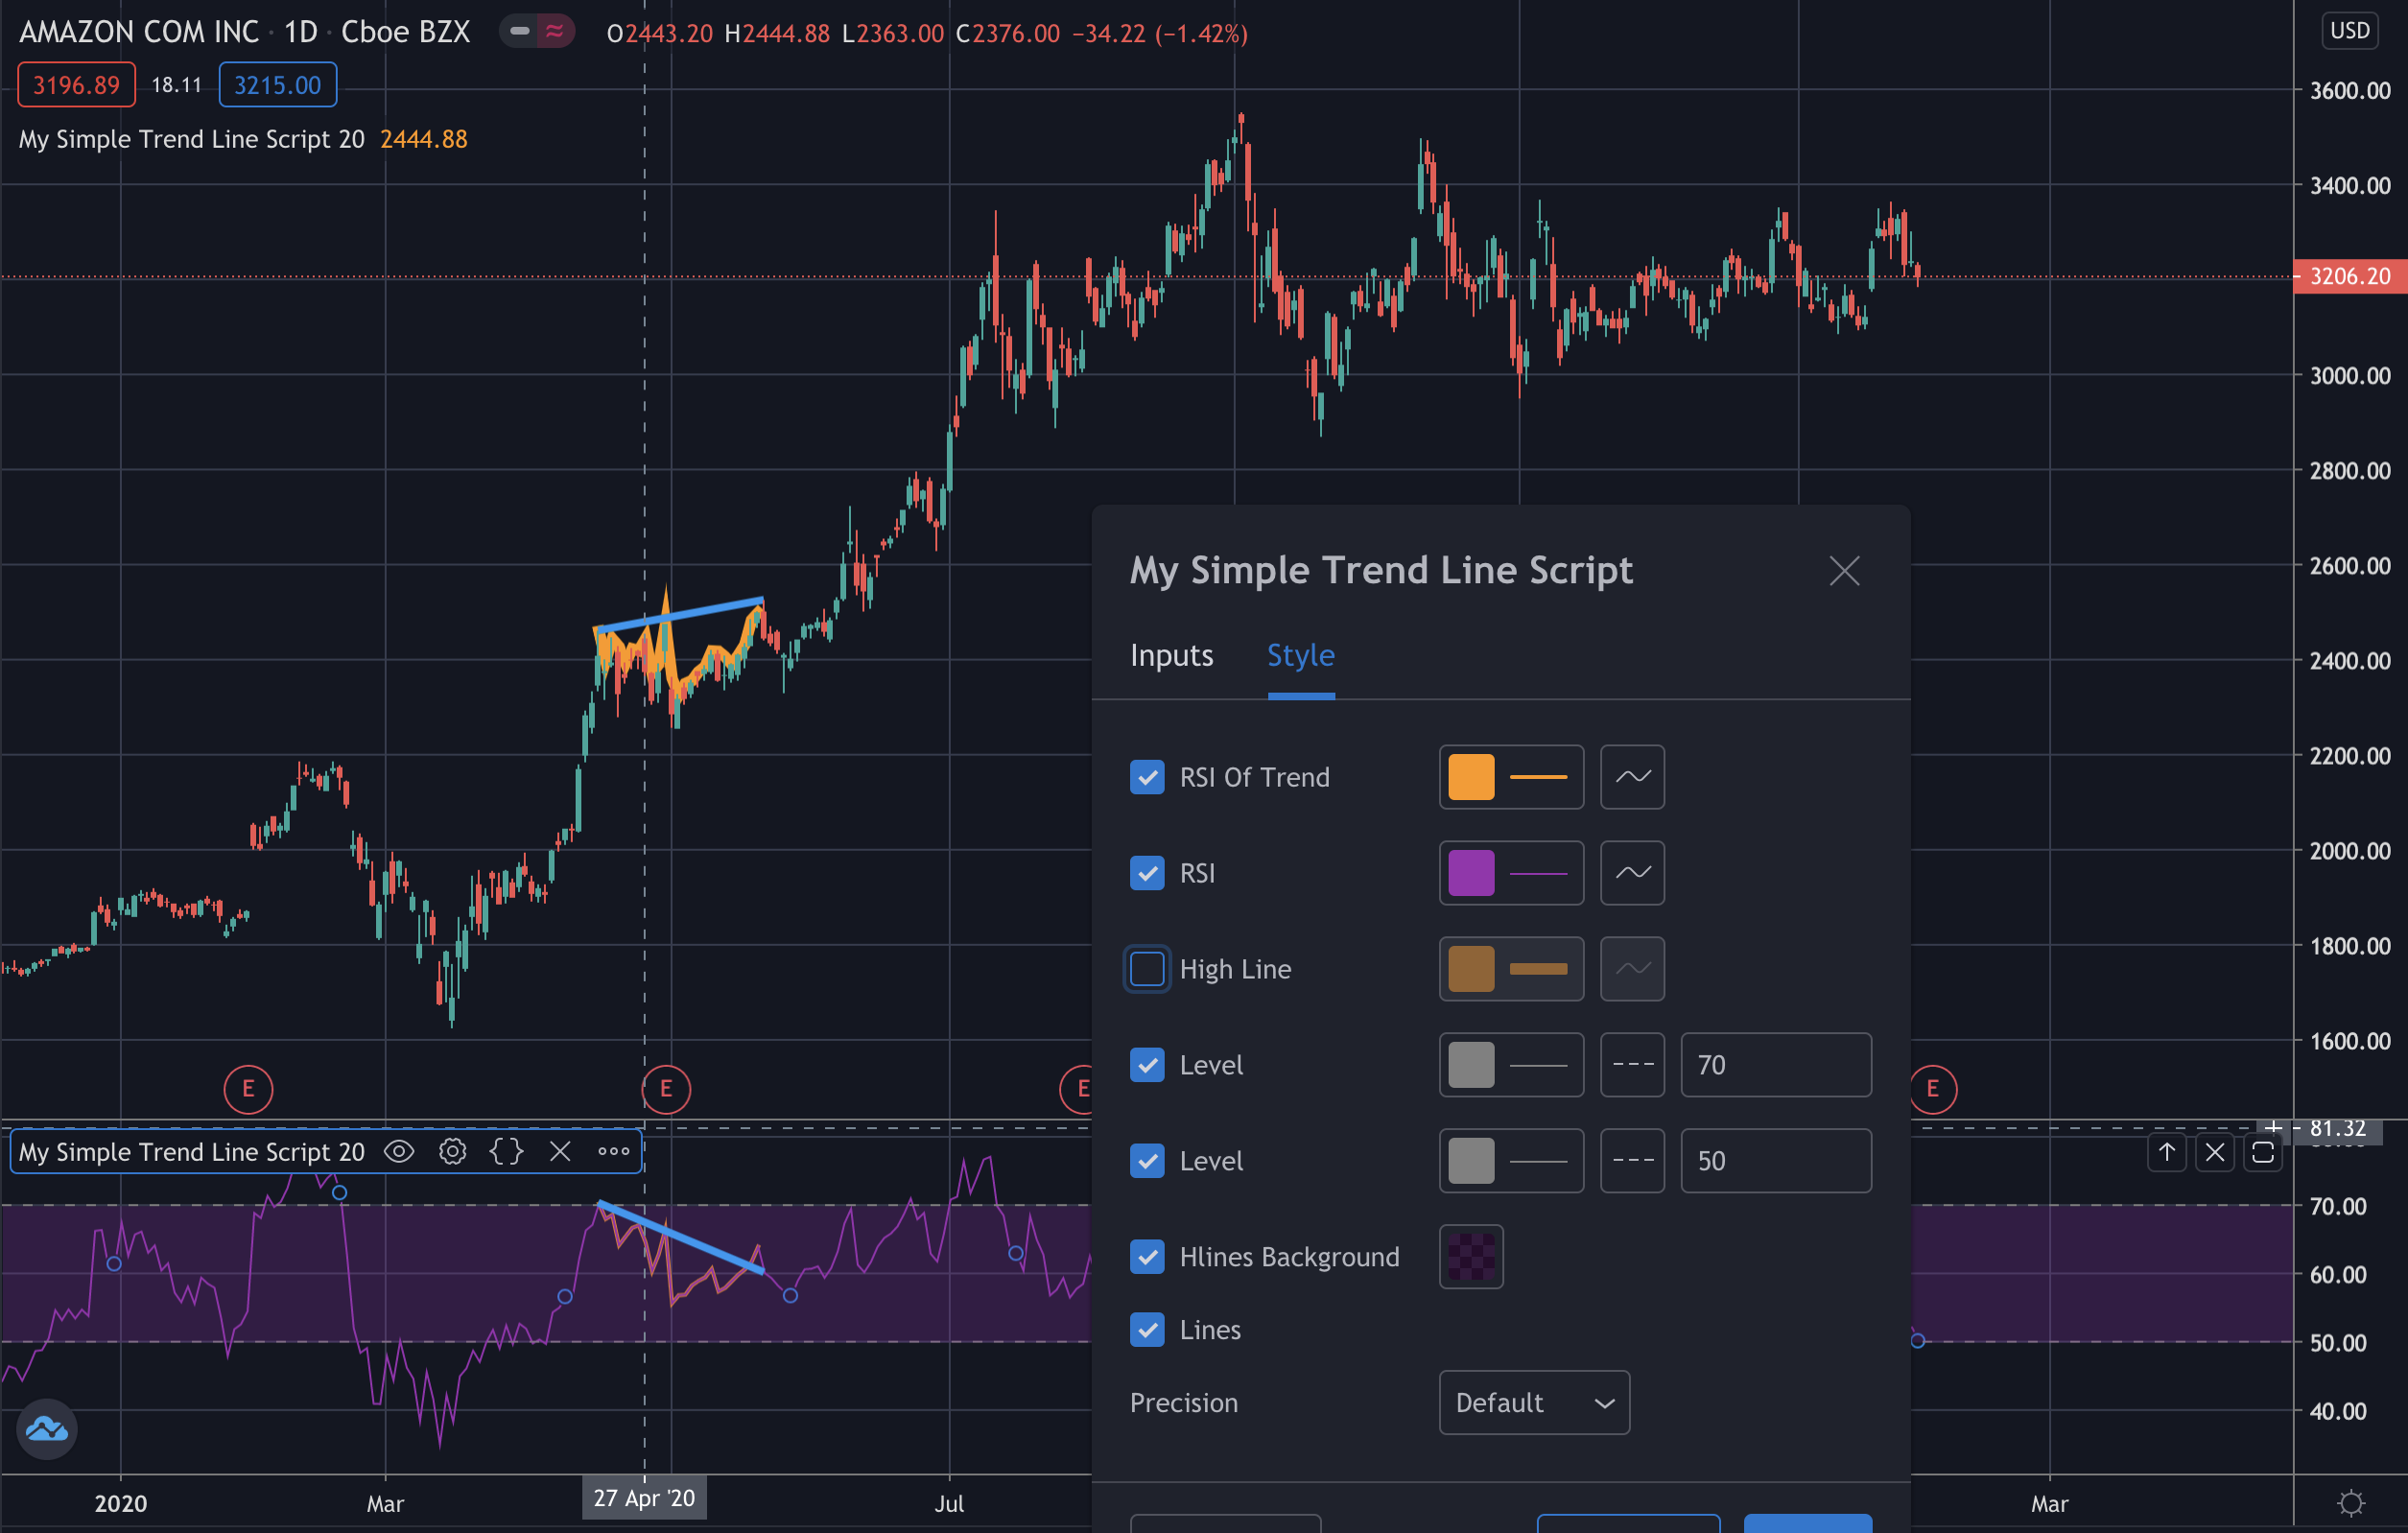
And then you can use the Settings and,
Style, for splitting the plots between the main chart and others
Input, for splitting the lines between the main chart and others
In the main chart, for selecting the plots, you can use Settings > Style
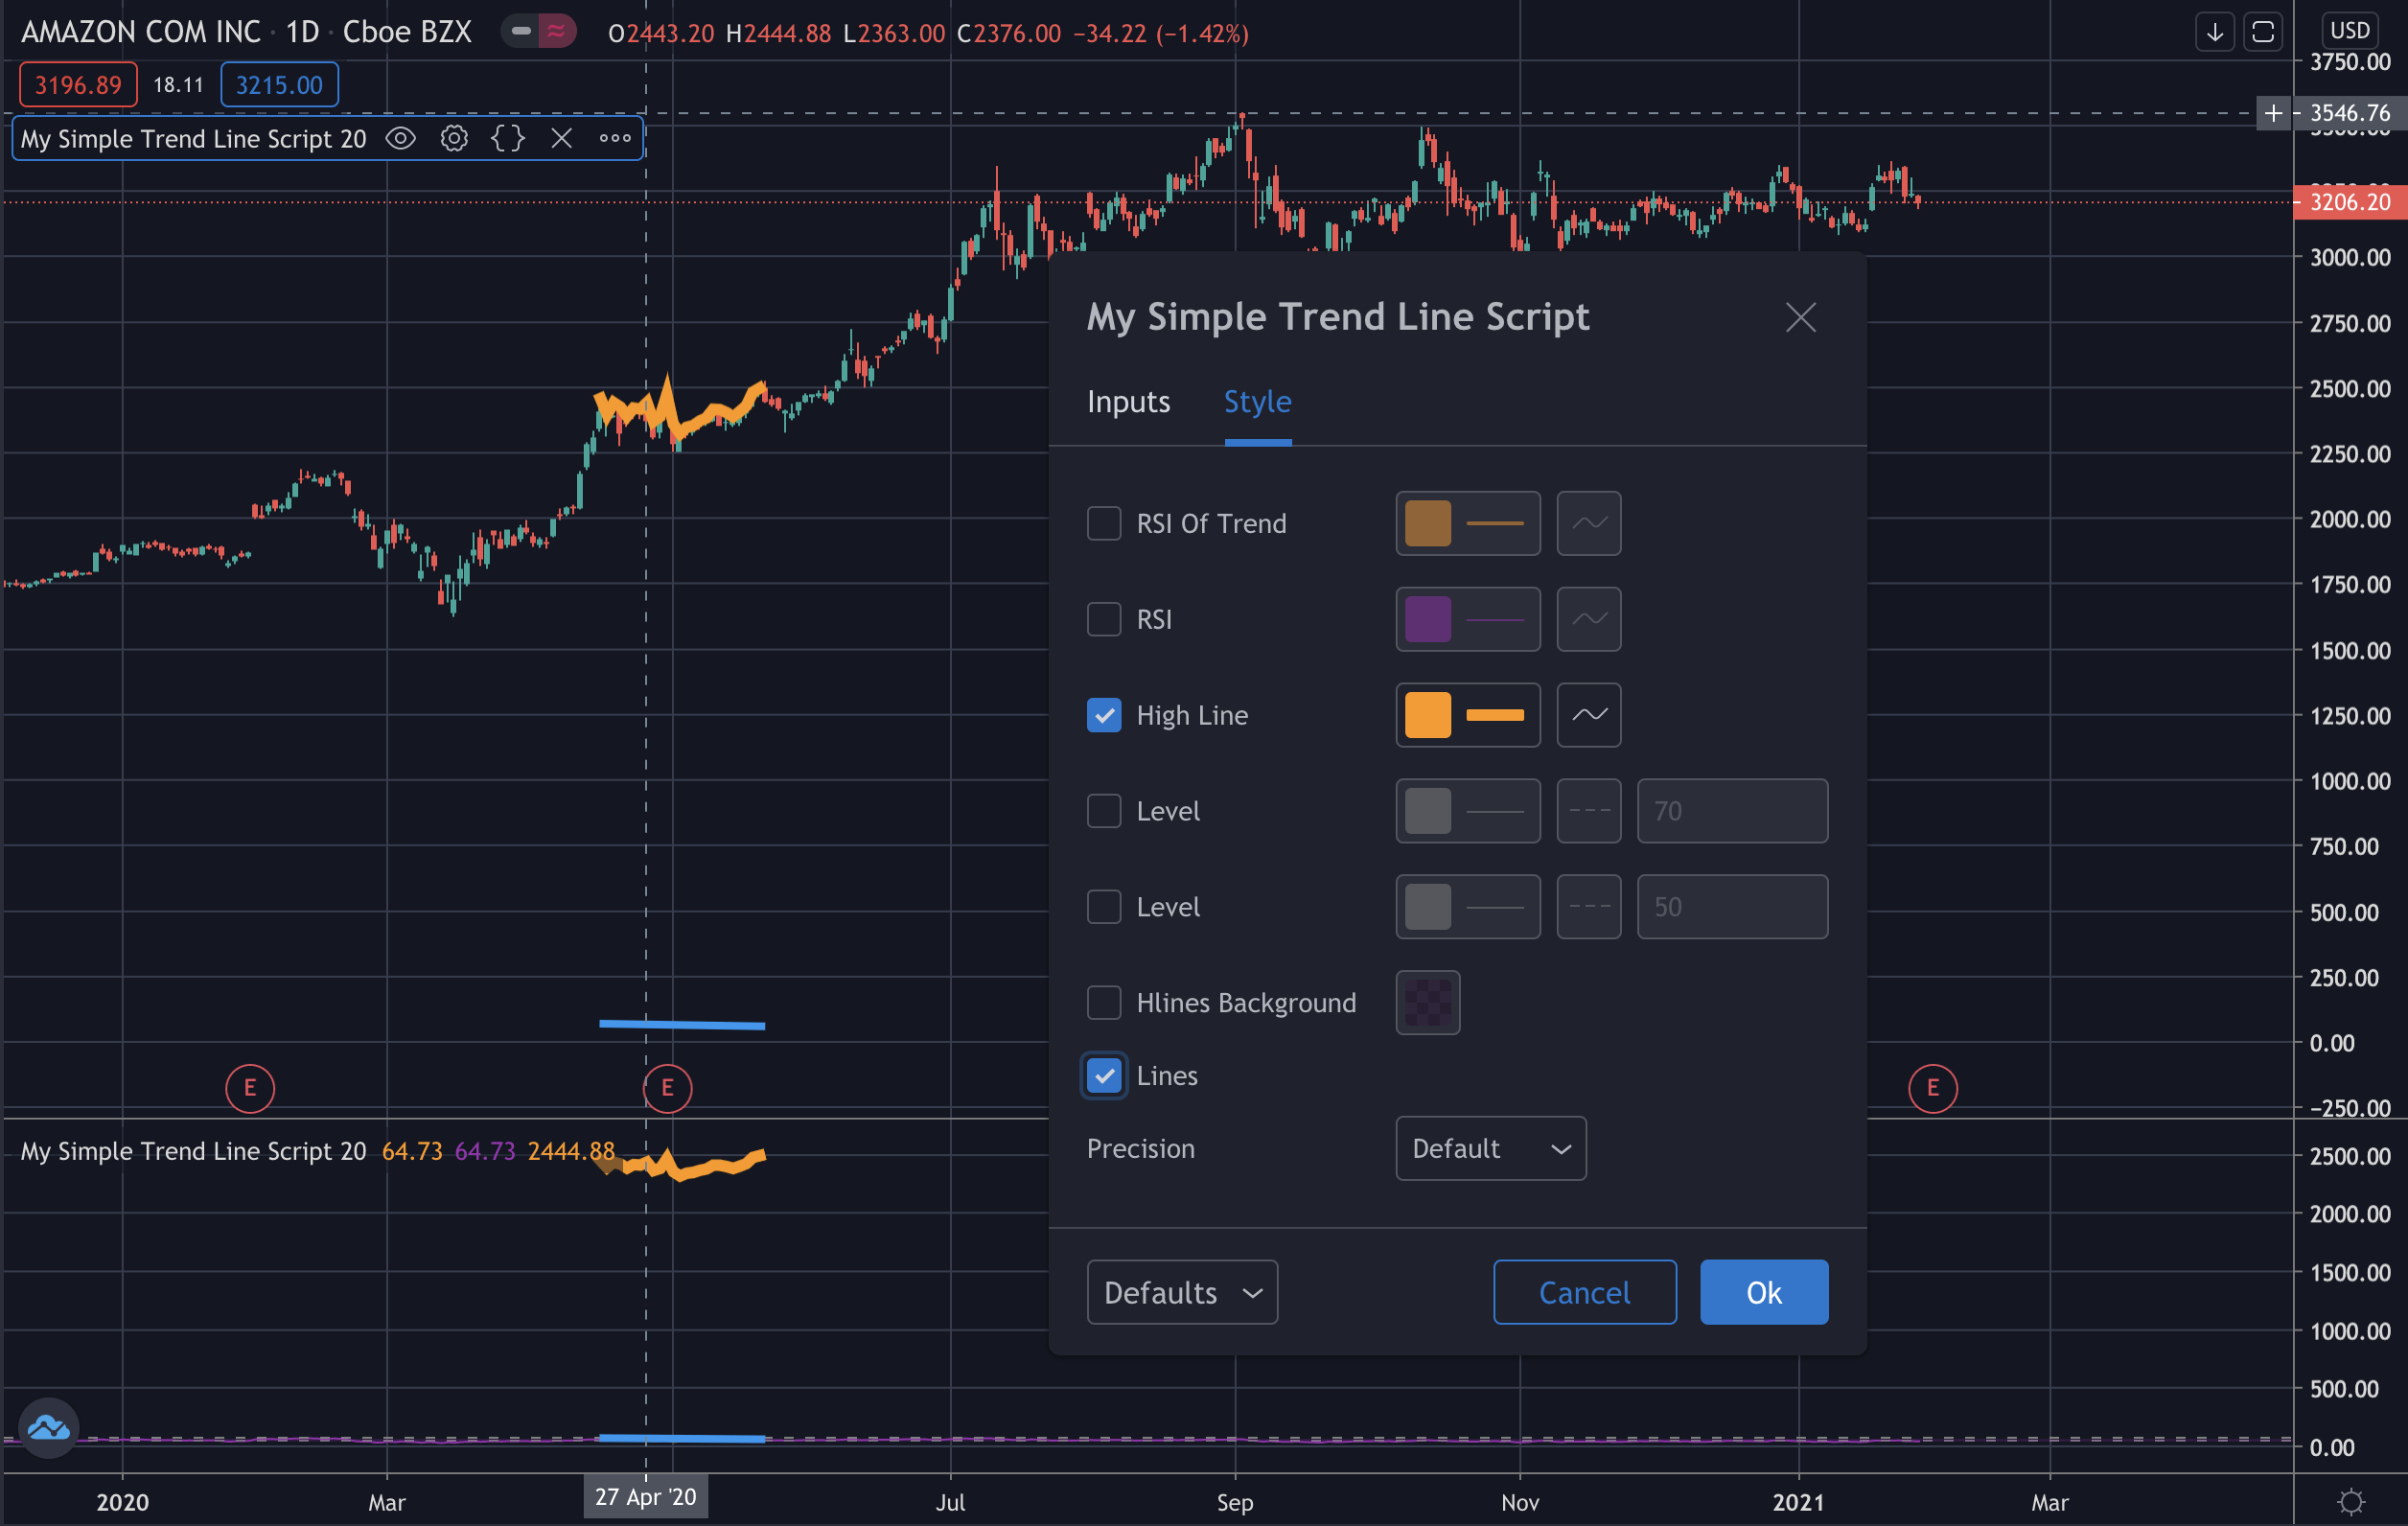
And Settings > Input, for showing the line on the main chart
Then, in the other chart, for selecting the plots, you can use Settings > Style
How to load signals on your strategy
The best practice is to prepare one variable for each signal that you want to use on your strategy. The strategy below use the moving averages that they are SMA and EMA. You can use one or the other.
Disclaimer
The strategies below are some simple samples for having an idea how to use the libraries: those strategies are for the educational purpose only. All investments and trading in the stock market involve risk: any decisions related to buying/selling of stocks or other financial instruments should only be made after a thorough research, backtesting, running in demo and seeking a professional assistance if required.
Moving Average Crossover Strategy - Sample 1
when the price value crosses the MA value from below, it will close any existing short position and go long (buy) one unit of the asset
when the price value crosses the MA value from above, it will close any existing long position and go short (sell) one unit of the asset
Reference: https://www.learndatasci.com/tutorials/python-finance-part-3-moving-average-trading-strategy/
//@version=4
//strategy("My Simple Strategy Script - sample 1") // a chart space dedicated
strategy("My Simple Strategy Script - sample 1", "", true) // in the main chart

legs = input(20)
//ma = sma(close, legs)
ma = ema(close, legs)
plot(ma, "Ma", color.orange, 2)
dev = 2 * stdev(close, legs)
upper = ma + dev
lower = ma - dev
p1 = plot(upper, title="BB upper", color=color.green, linewidth=1, style=plot.style_circles)
p2 = plot(lower, title="BB lower", color=color.green, linewidth=1, style=plot.style_circles)
fill(p1, p2)

// Taking the difference between the prices and the MA timeseries
price_ma_diff = close - ma

// Taking the sign of the difference to determine whether the price or the EMA is greater
position = price_ma_diff - price_ma_diff[1]
buyEntry = position >= 2 ? price_ma_diff : na
sellEntry = position <= -2 ? price_ma_diff : na

if (buyEntry)
//    strategy.entry("MaLE", strategy.long, stop=lower, oca_name="Ma", oca_type=strategy.oca.cancel, comment="MaLE")
    strategy.entry("MaLE", strategy.long, oca_name="Ma", oca_type=strategy.oca.cancel, comment="MaLE")
else
    strategy.cancel(id="MaLE")

if (sellEntry)
//    strategy.entry("MaSE", strategy.short, stop=upper, oca_name="Ma", oca_type=strategy.oca.cancel, comment="MaSE")
    strategy.entry("MaSE", strategy.short, oca_name="Ma", oca_type=strategy.oca.cancel, comment="MaSE")
else
    strategy.cancel(id="MaSE")

plot(strategy.equity, title="Equity", color=color.red, linewidth=2, style=plot.style_areabr)
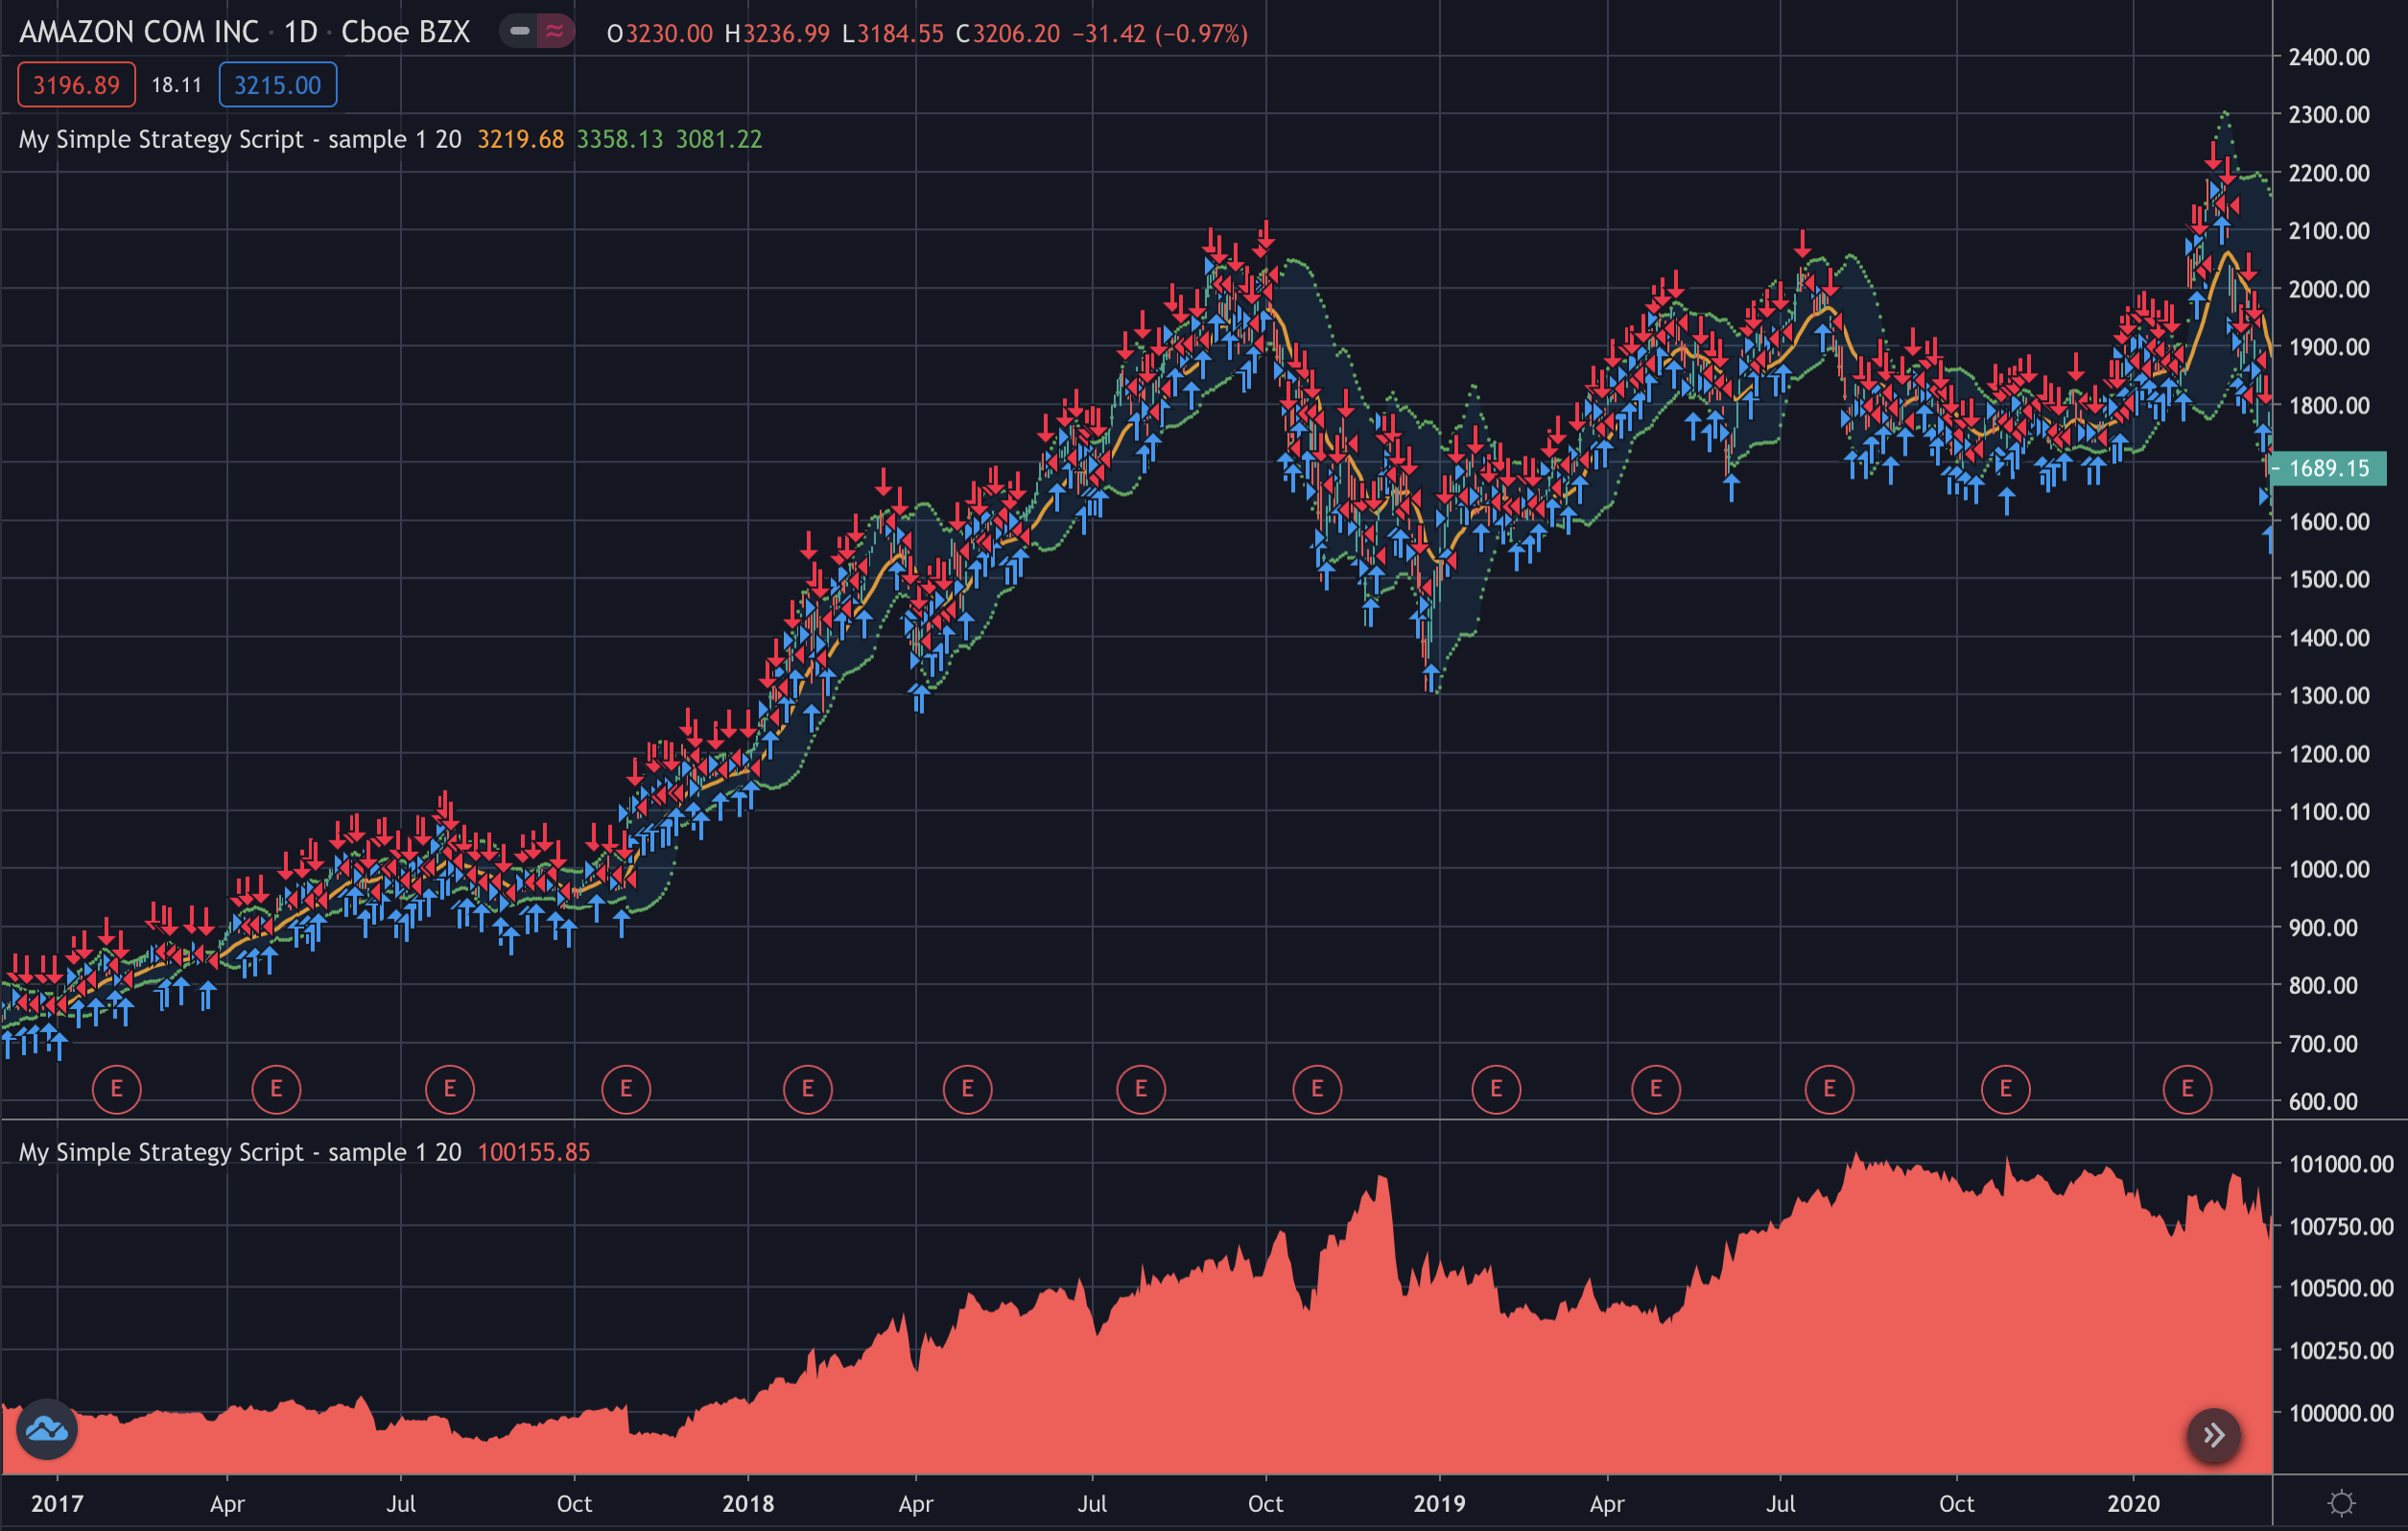
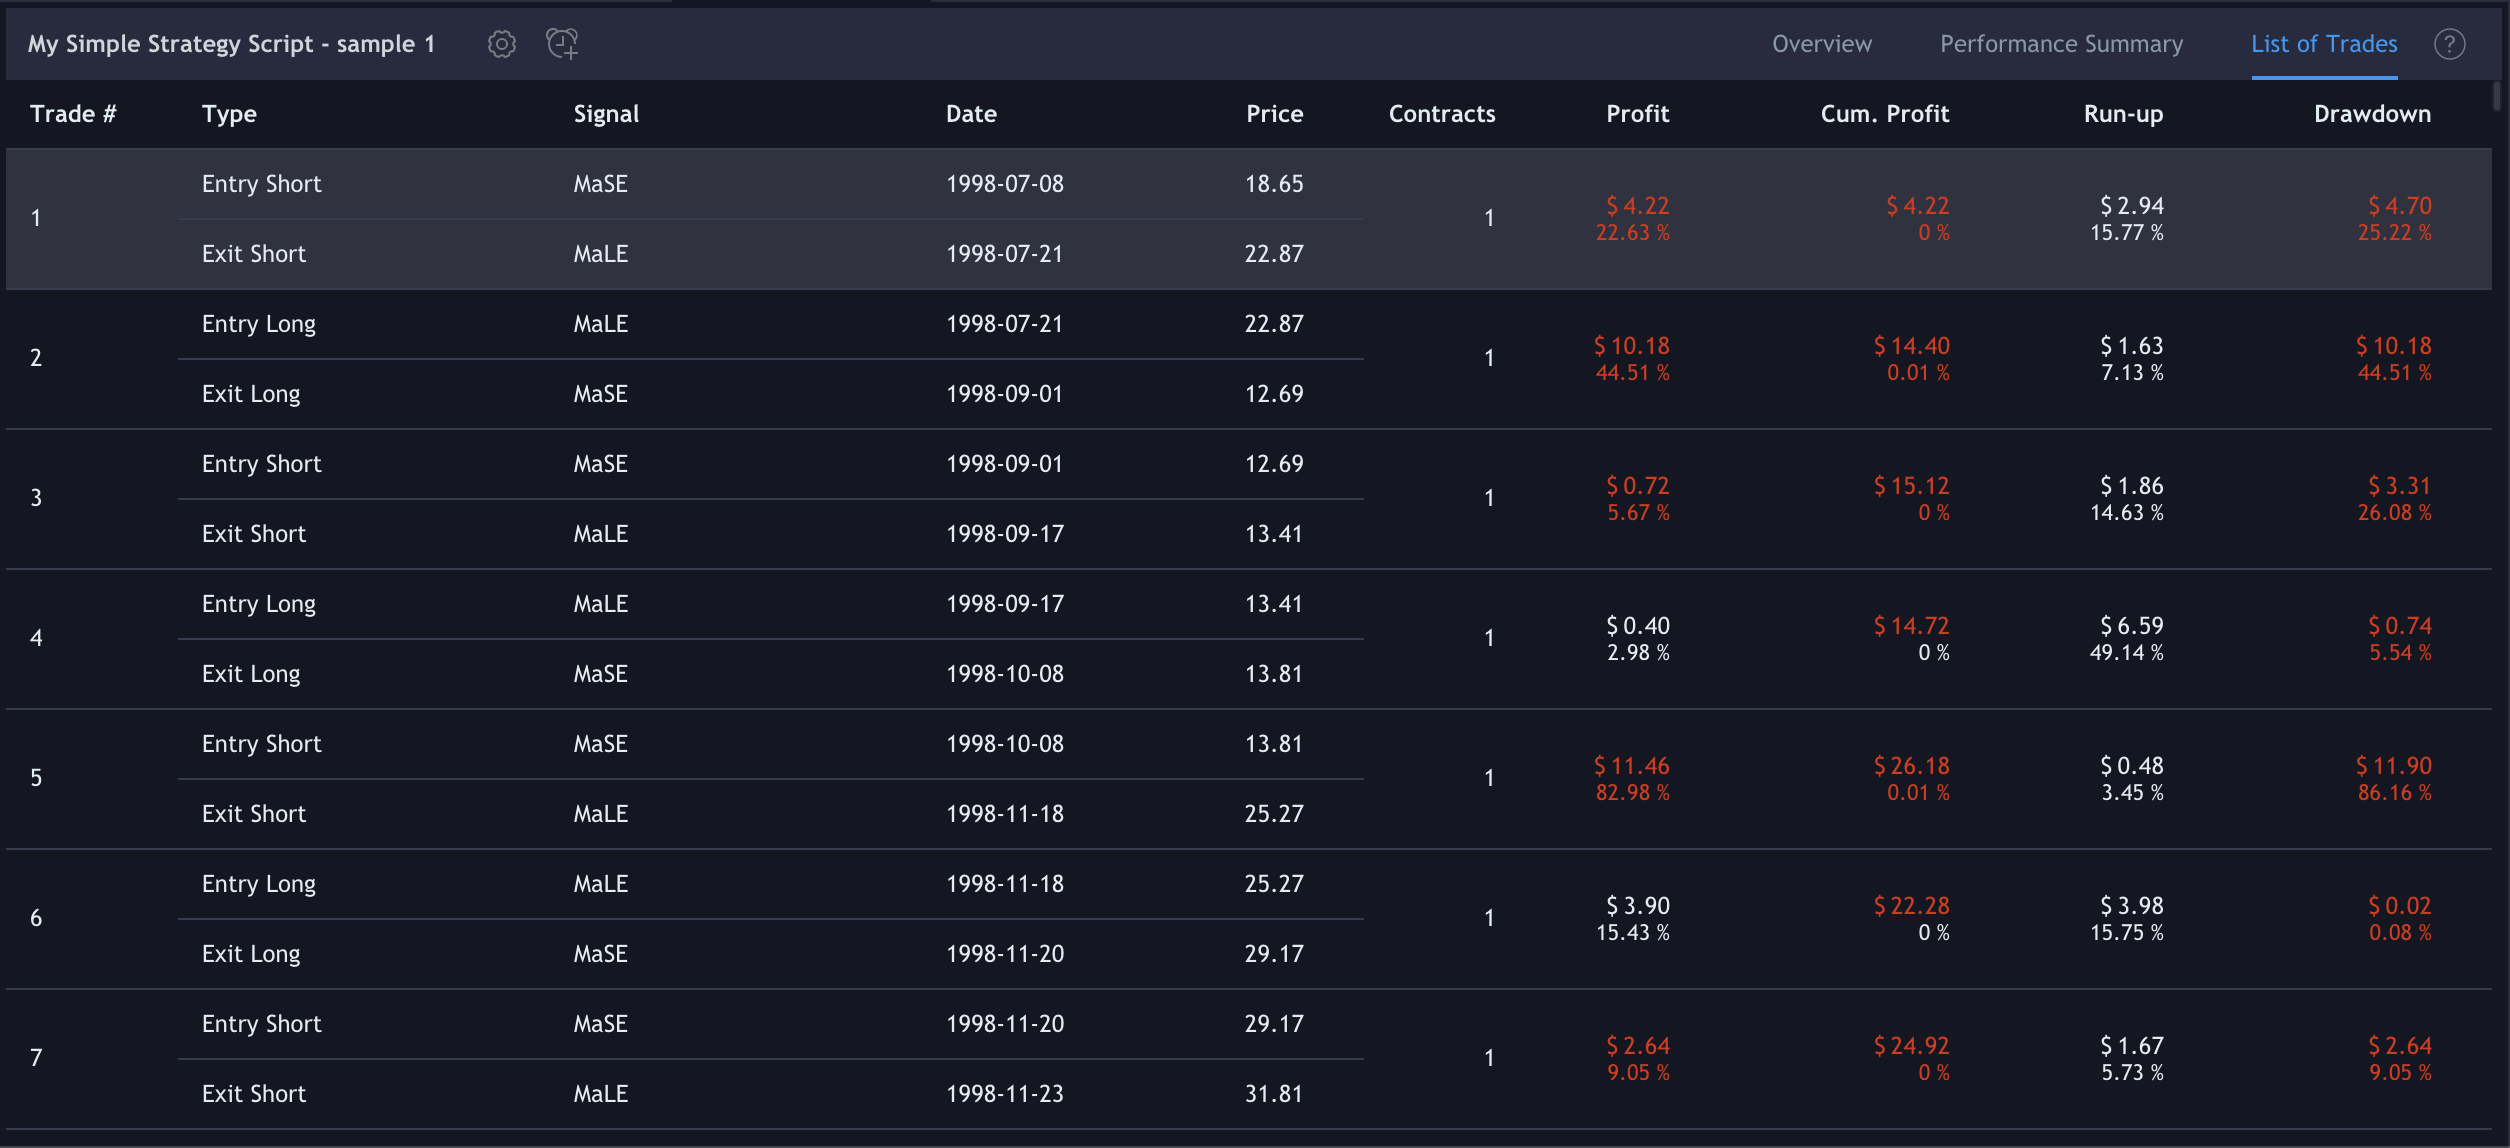
When you Add to Chart your strategy, the Strategy Tester tab will contain the results of your backtesting:
an Overview of the main parameters like Net Profit and Drawdown
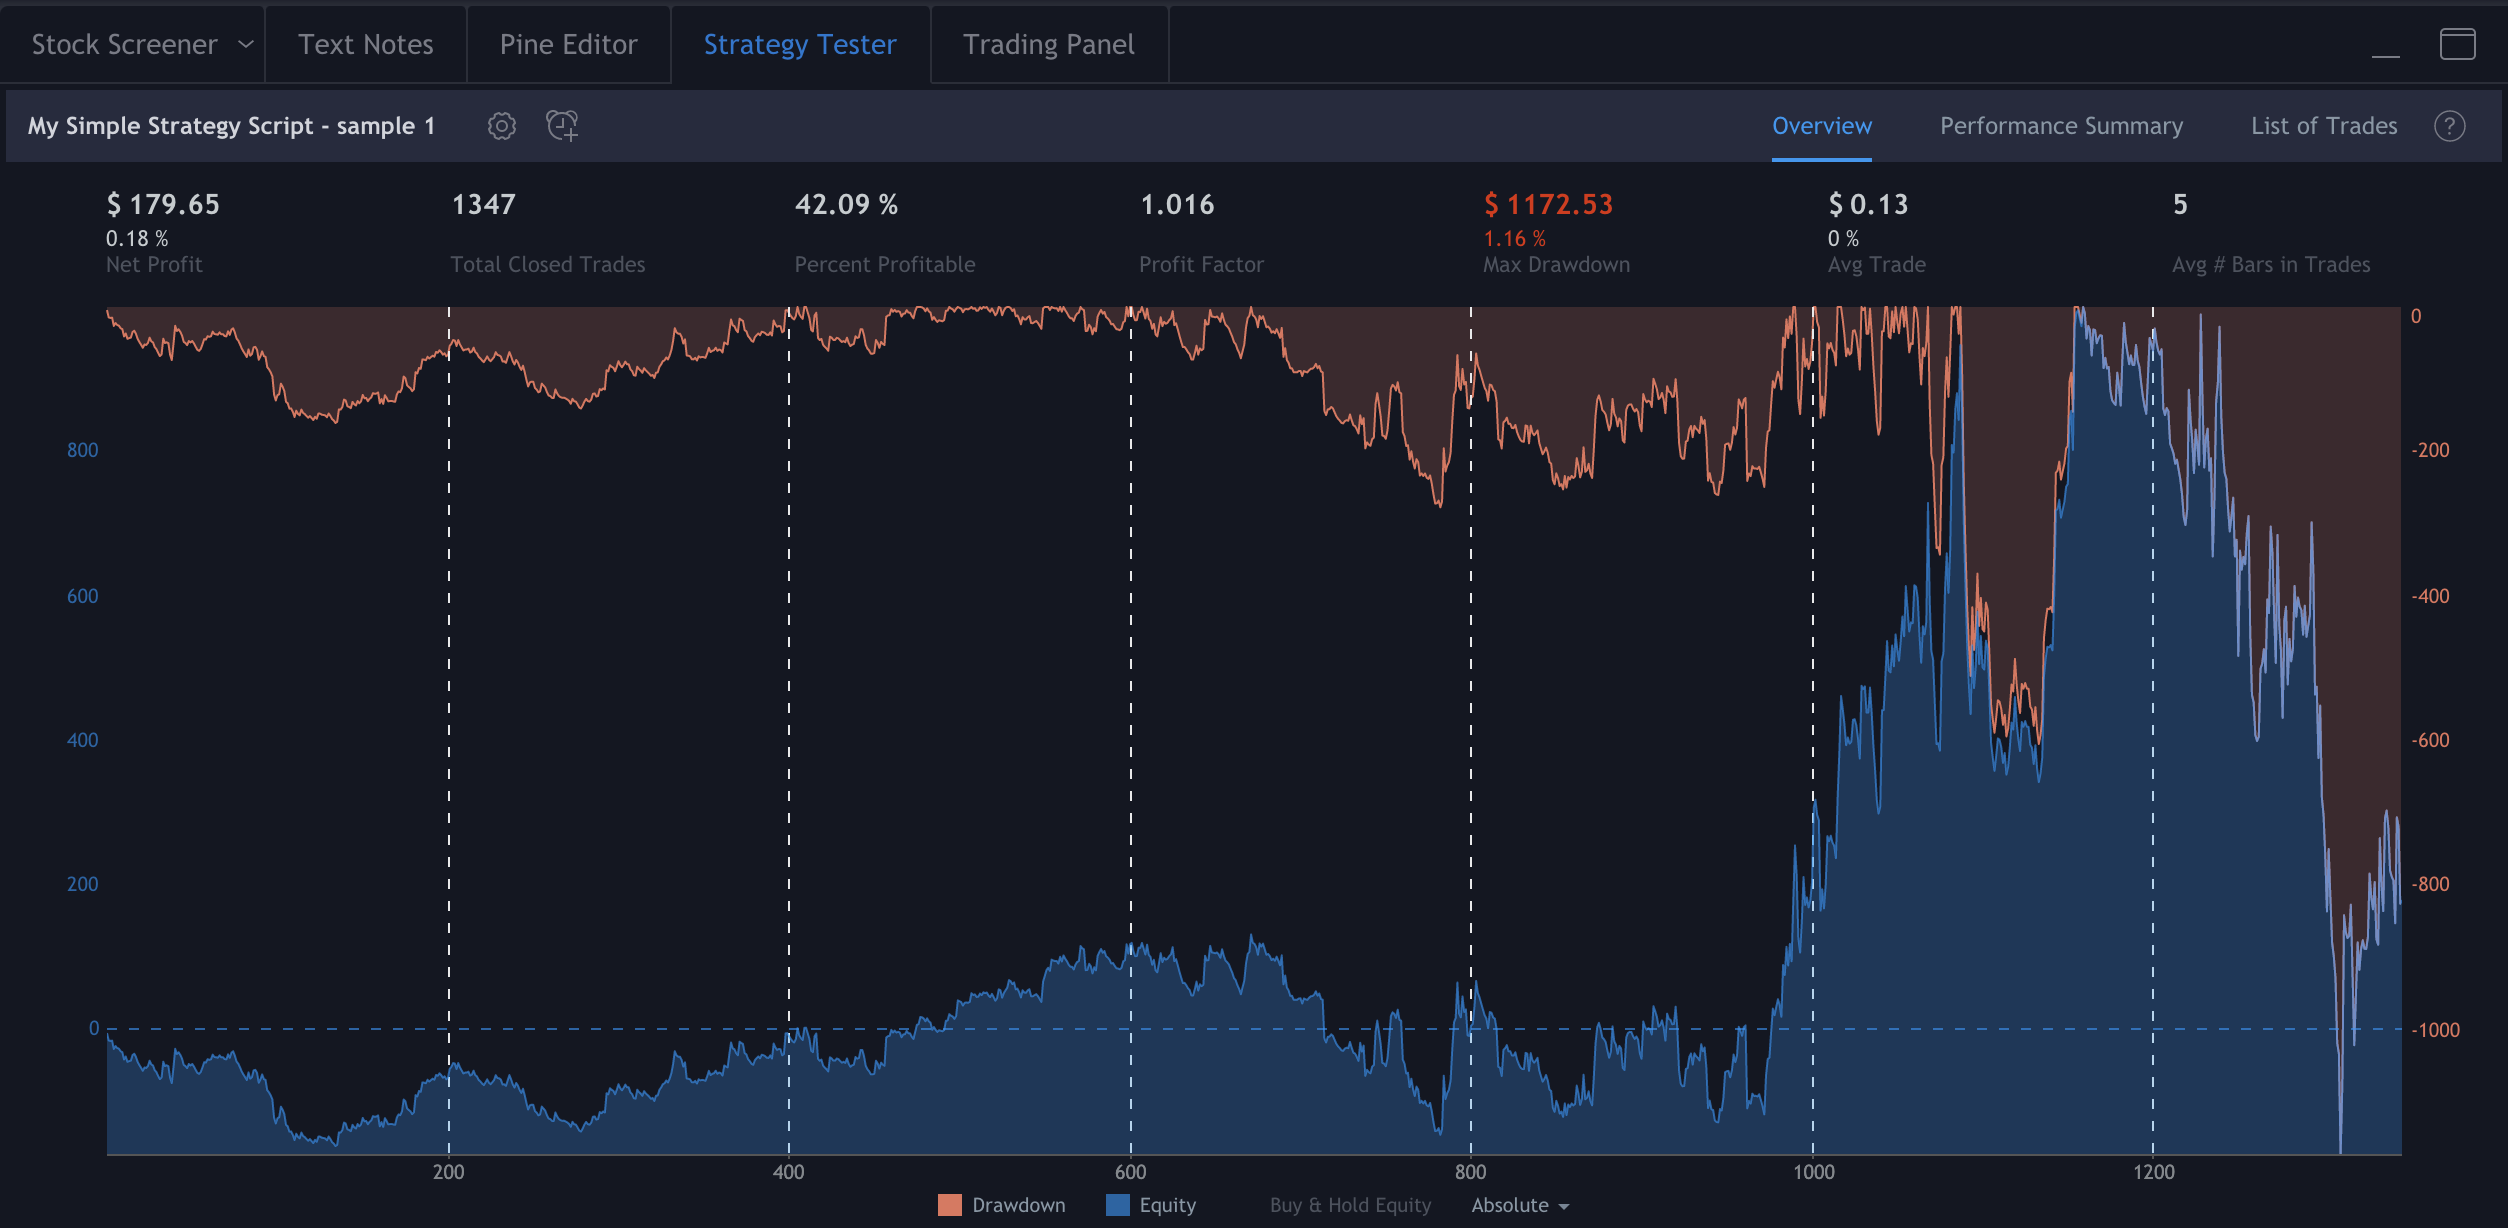
the Performance Summary with all important parameters for defining if your backtesting is good or not
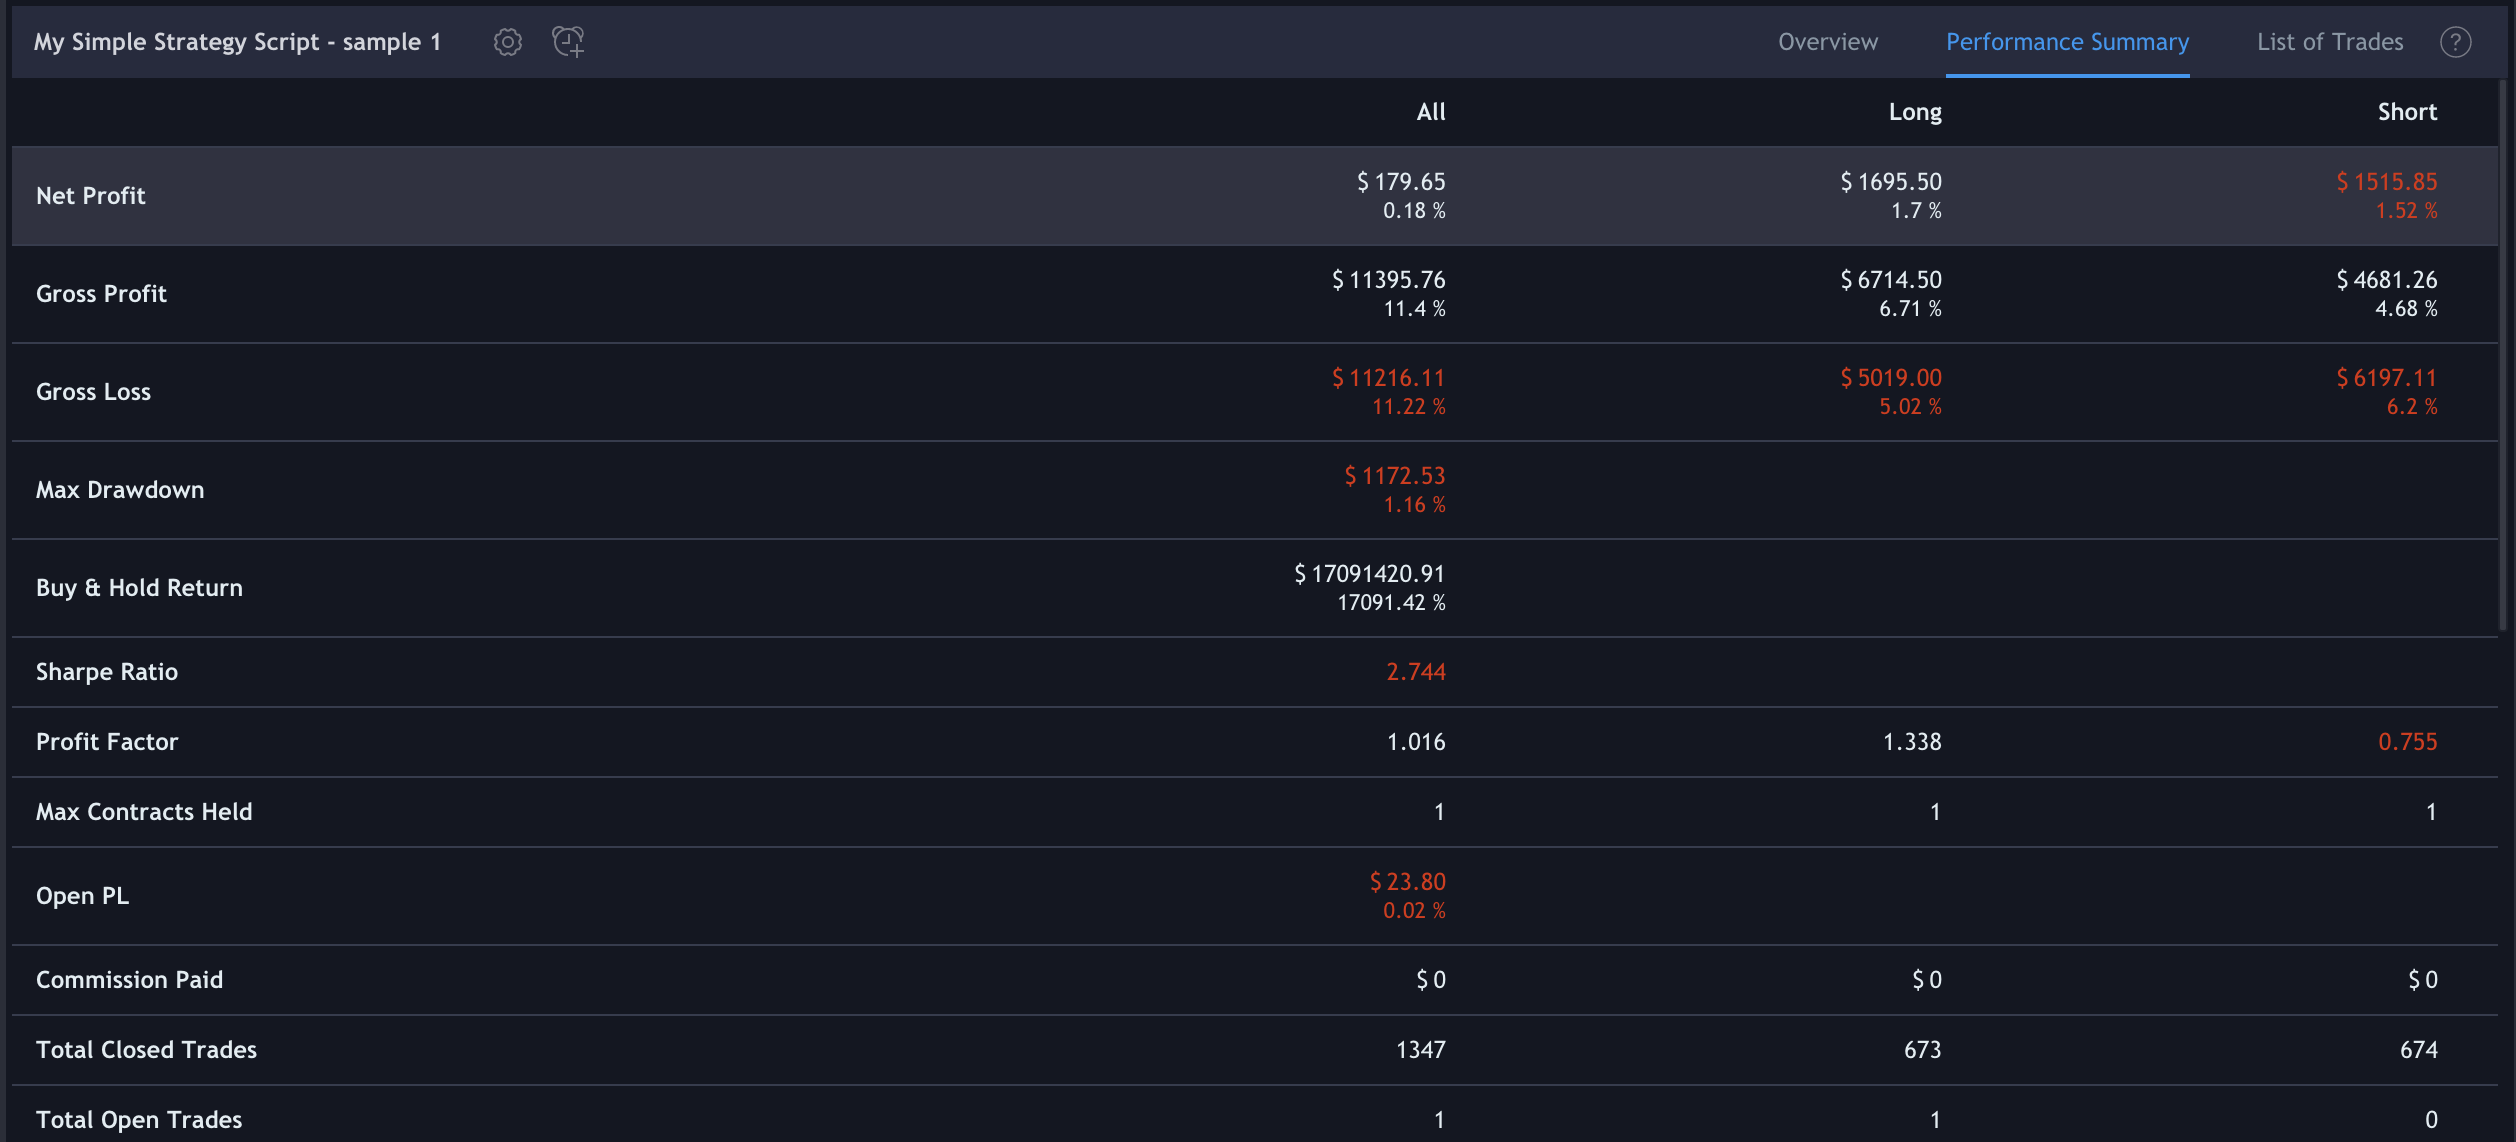
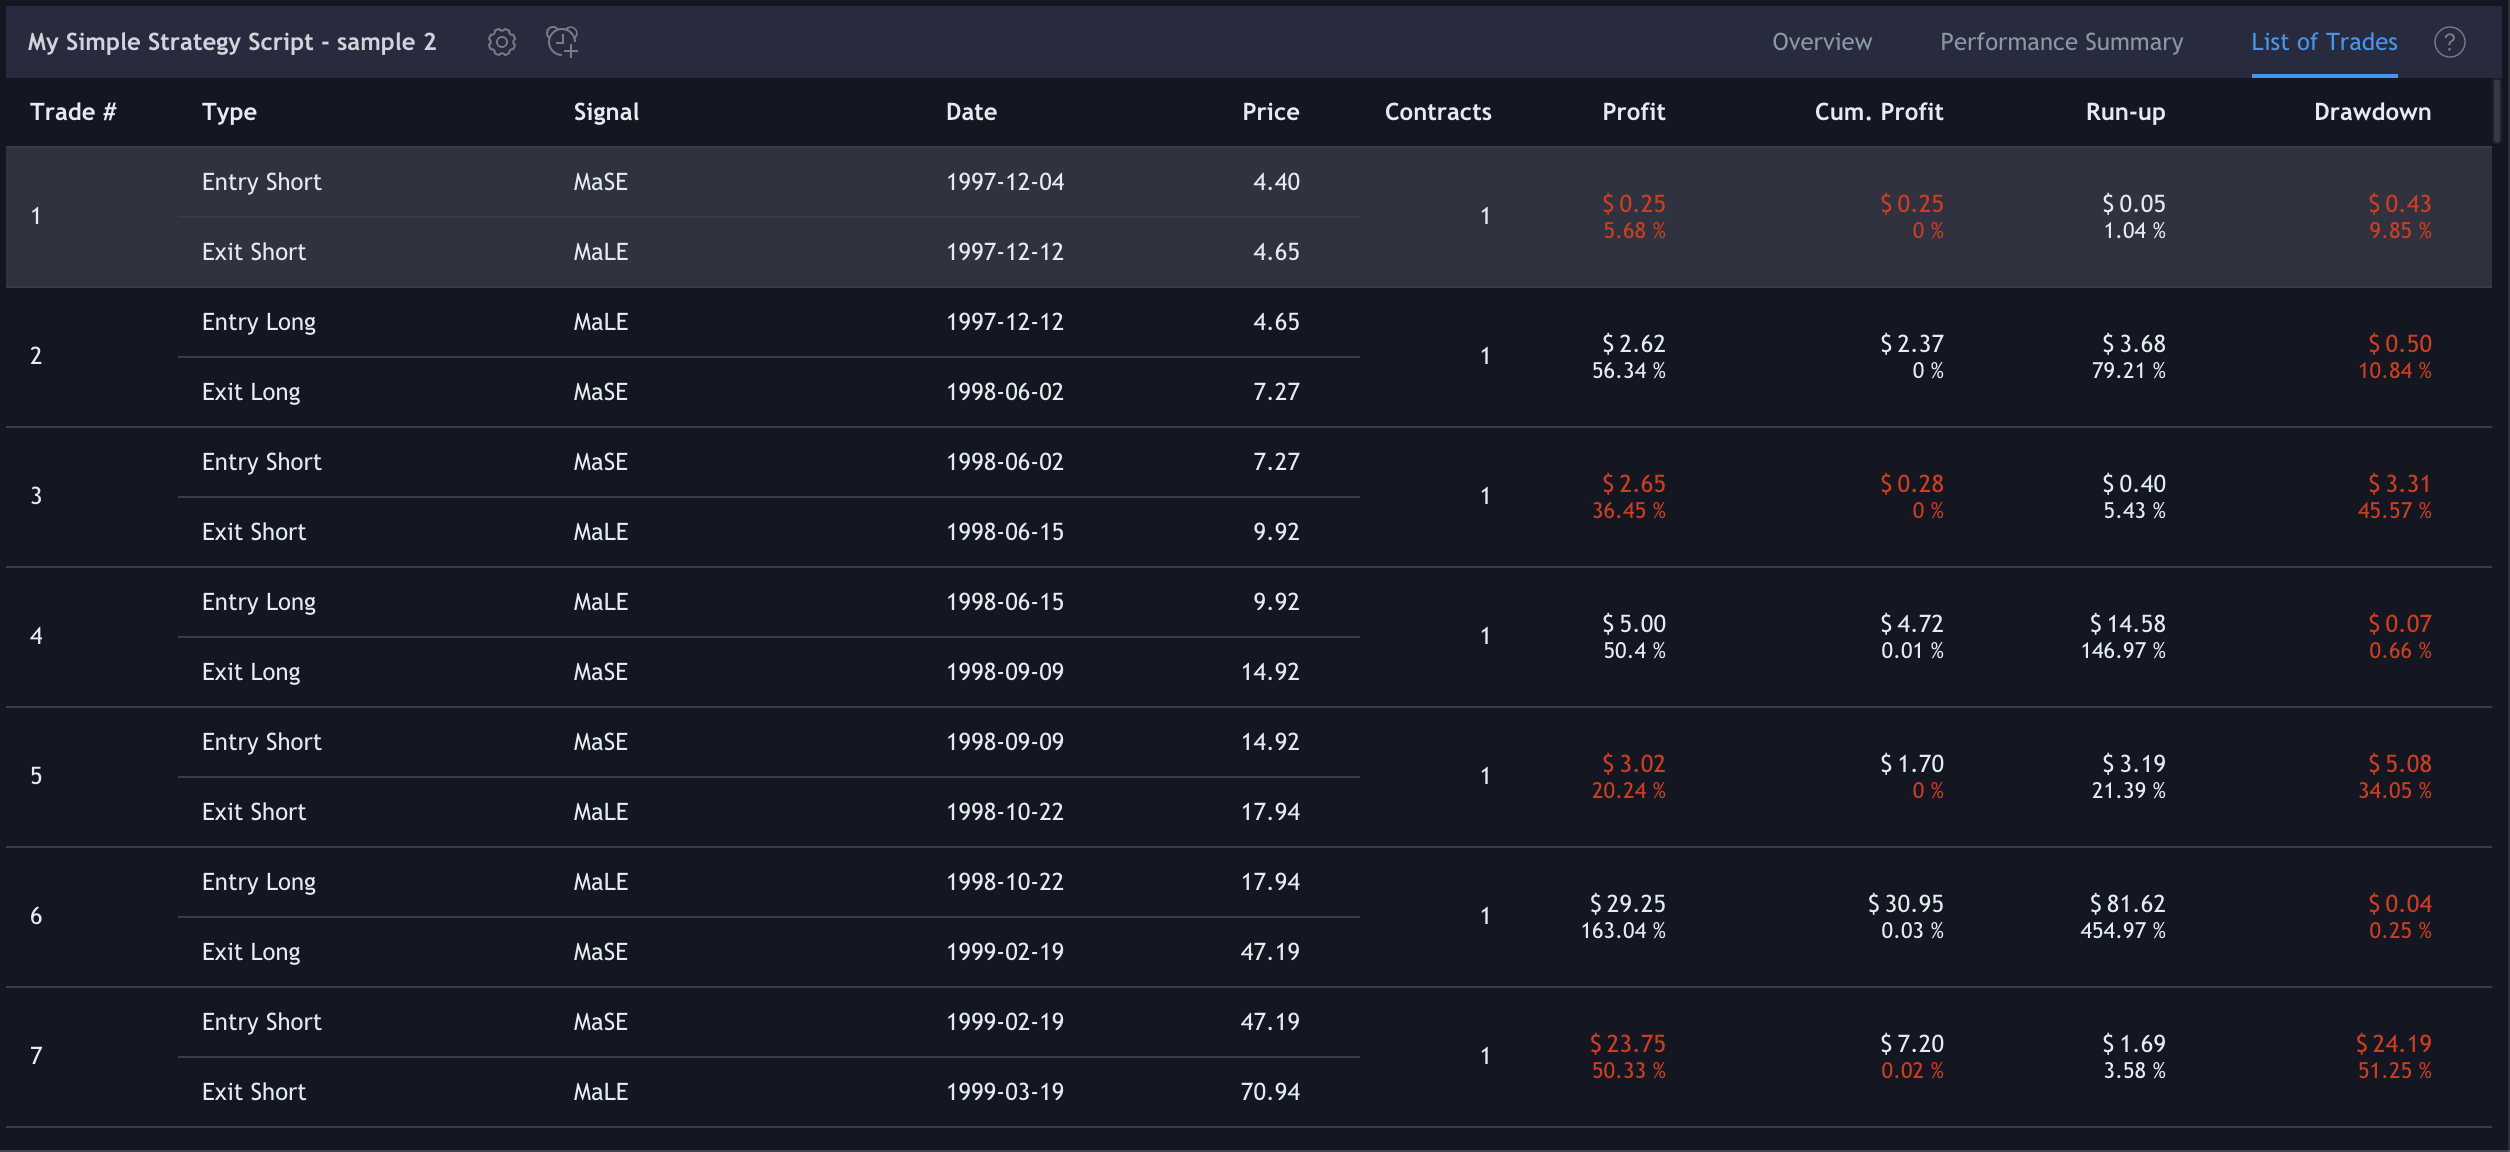
the List of Trades with the details of each trade like Date, Price and Profit
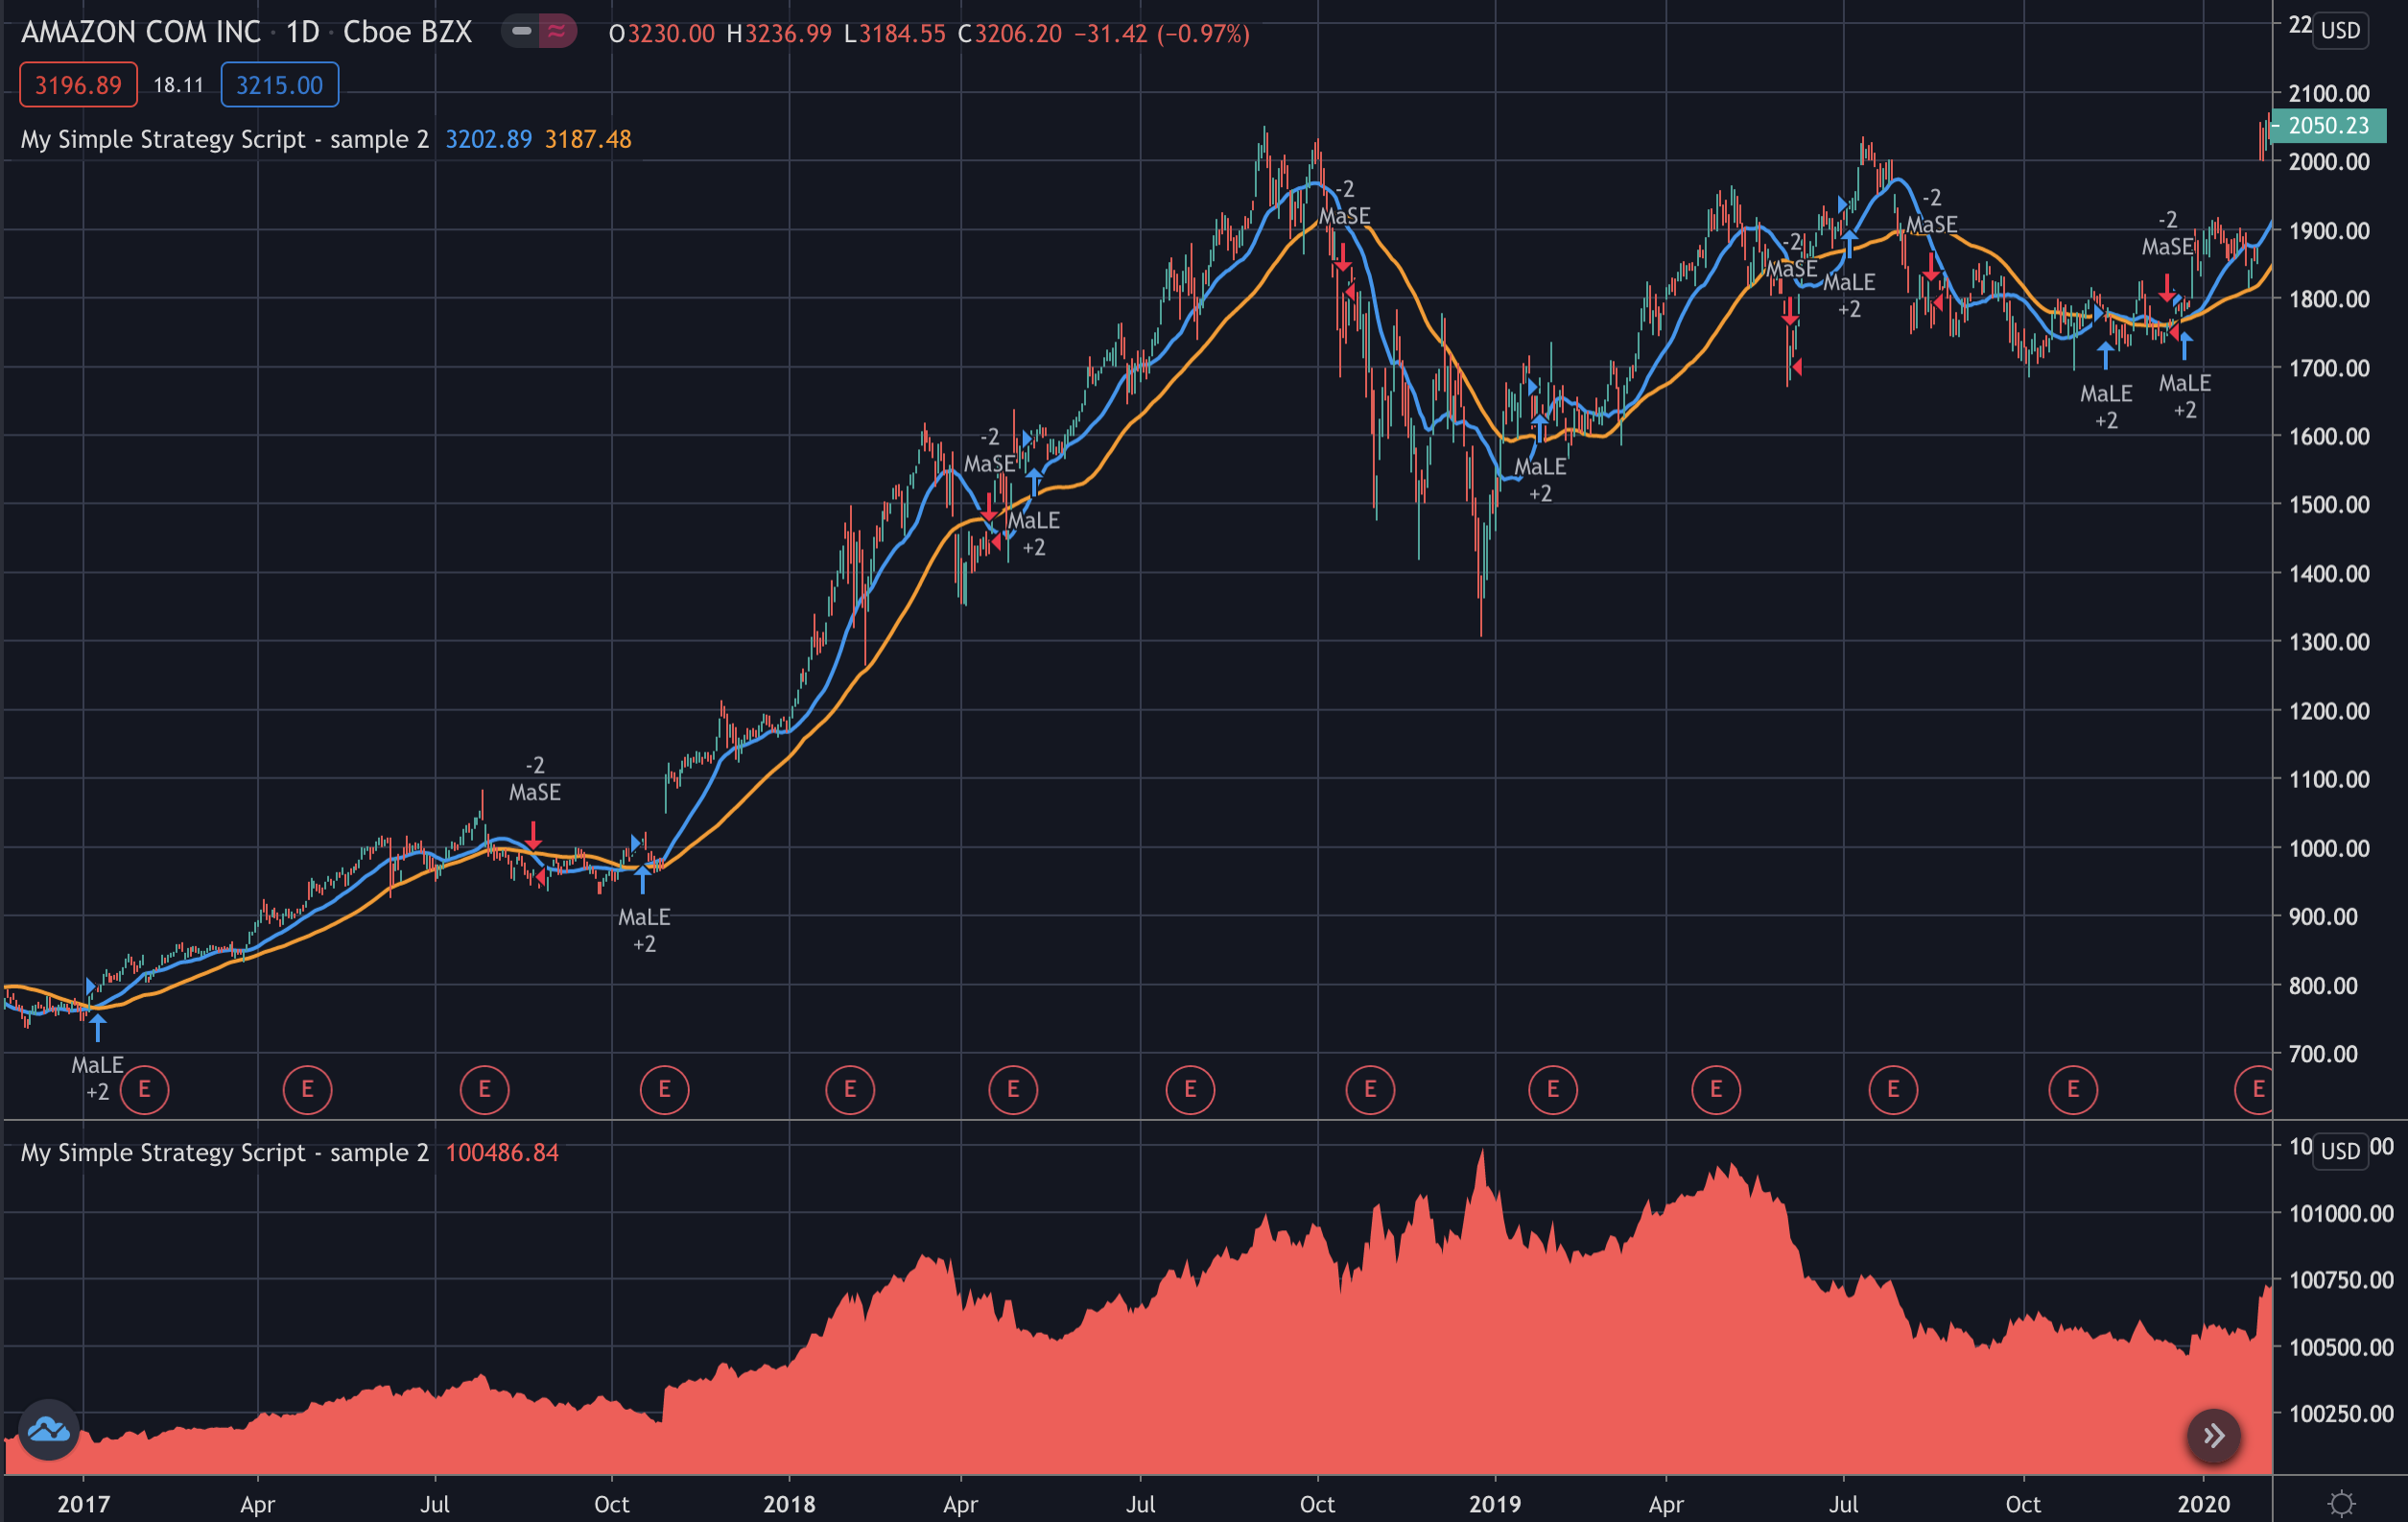
Moving Average Crossover Strategy - Sample 2
when the short term moving average crosses above the long term moving average, this indicates a buy signal
when the short term moving average crosses below the long term moving average, it may be a good moment to sell
//@version=4
//strategy("My Simple Strategy Script - sample 2") // a chart space dedicated
strategy("My Simple Strategy Script - sample 2", "", true) // in the main chart

ma20 = sma(close, 20)
ma50 = sma(close, 50)
//ma20 = ema(close, 20)
//ma50 = ema(close, 50)
plot(ma20, "Ma20", color.blue, 2)
plot(ma50, "Ma50", color.orange, 2)

buyEntry = crossover(ma20, ma50)
sellEntry = crossunder(ma20, ma50)

if (buyEntry)
    strategy.entry("MaLE", strategy.long, oca_name="Ma", oca_type=strategy.oca.cancel, comment="MaLE")
else
    strategy.cancel(id="MaLE")

if (sellEntry)
    strategy.entry("MaSE", strategy.short, oca_name="Ma", oca_type=strategy.oca.cancel, comment="MaSE")
else
    strategy.cancel(id="MaSE")

plot(strategy.equity, title="Equity", color=color.red, linewidth=2, style=plot.style_areabr)
When you Add to Chart your strategy, the Strategy Tester tab will contain the results of your backtesting:
Overview
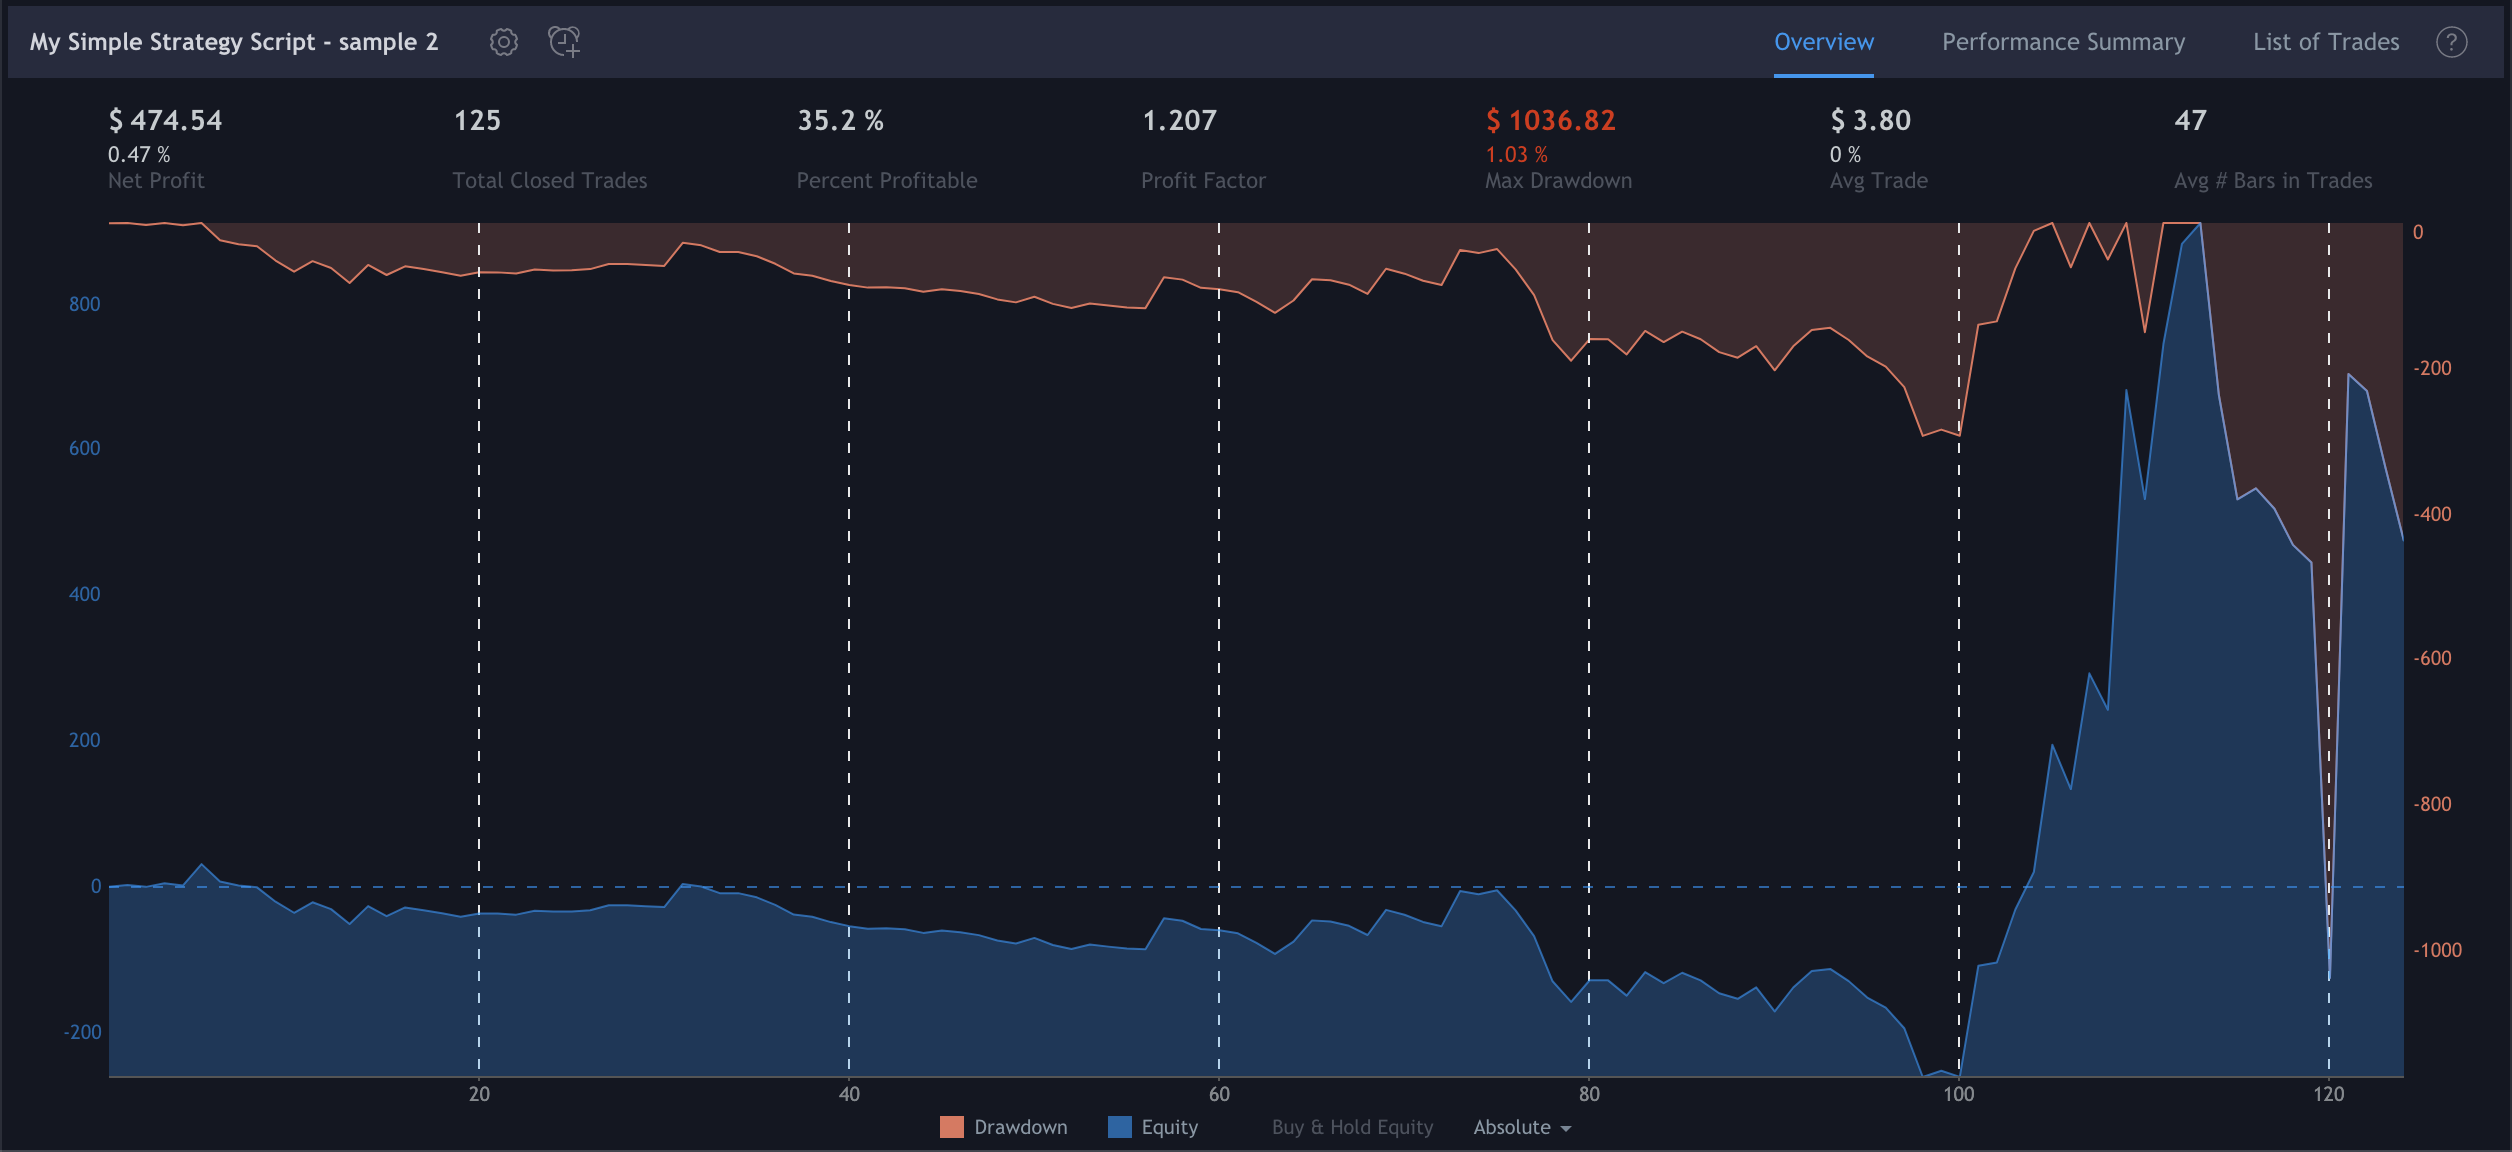
Performance Summary
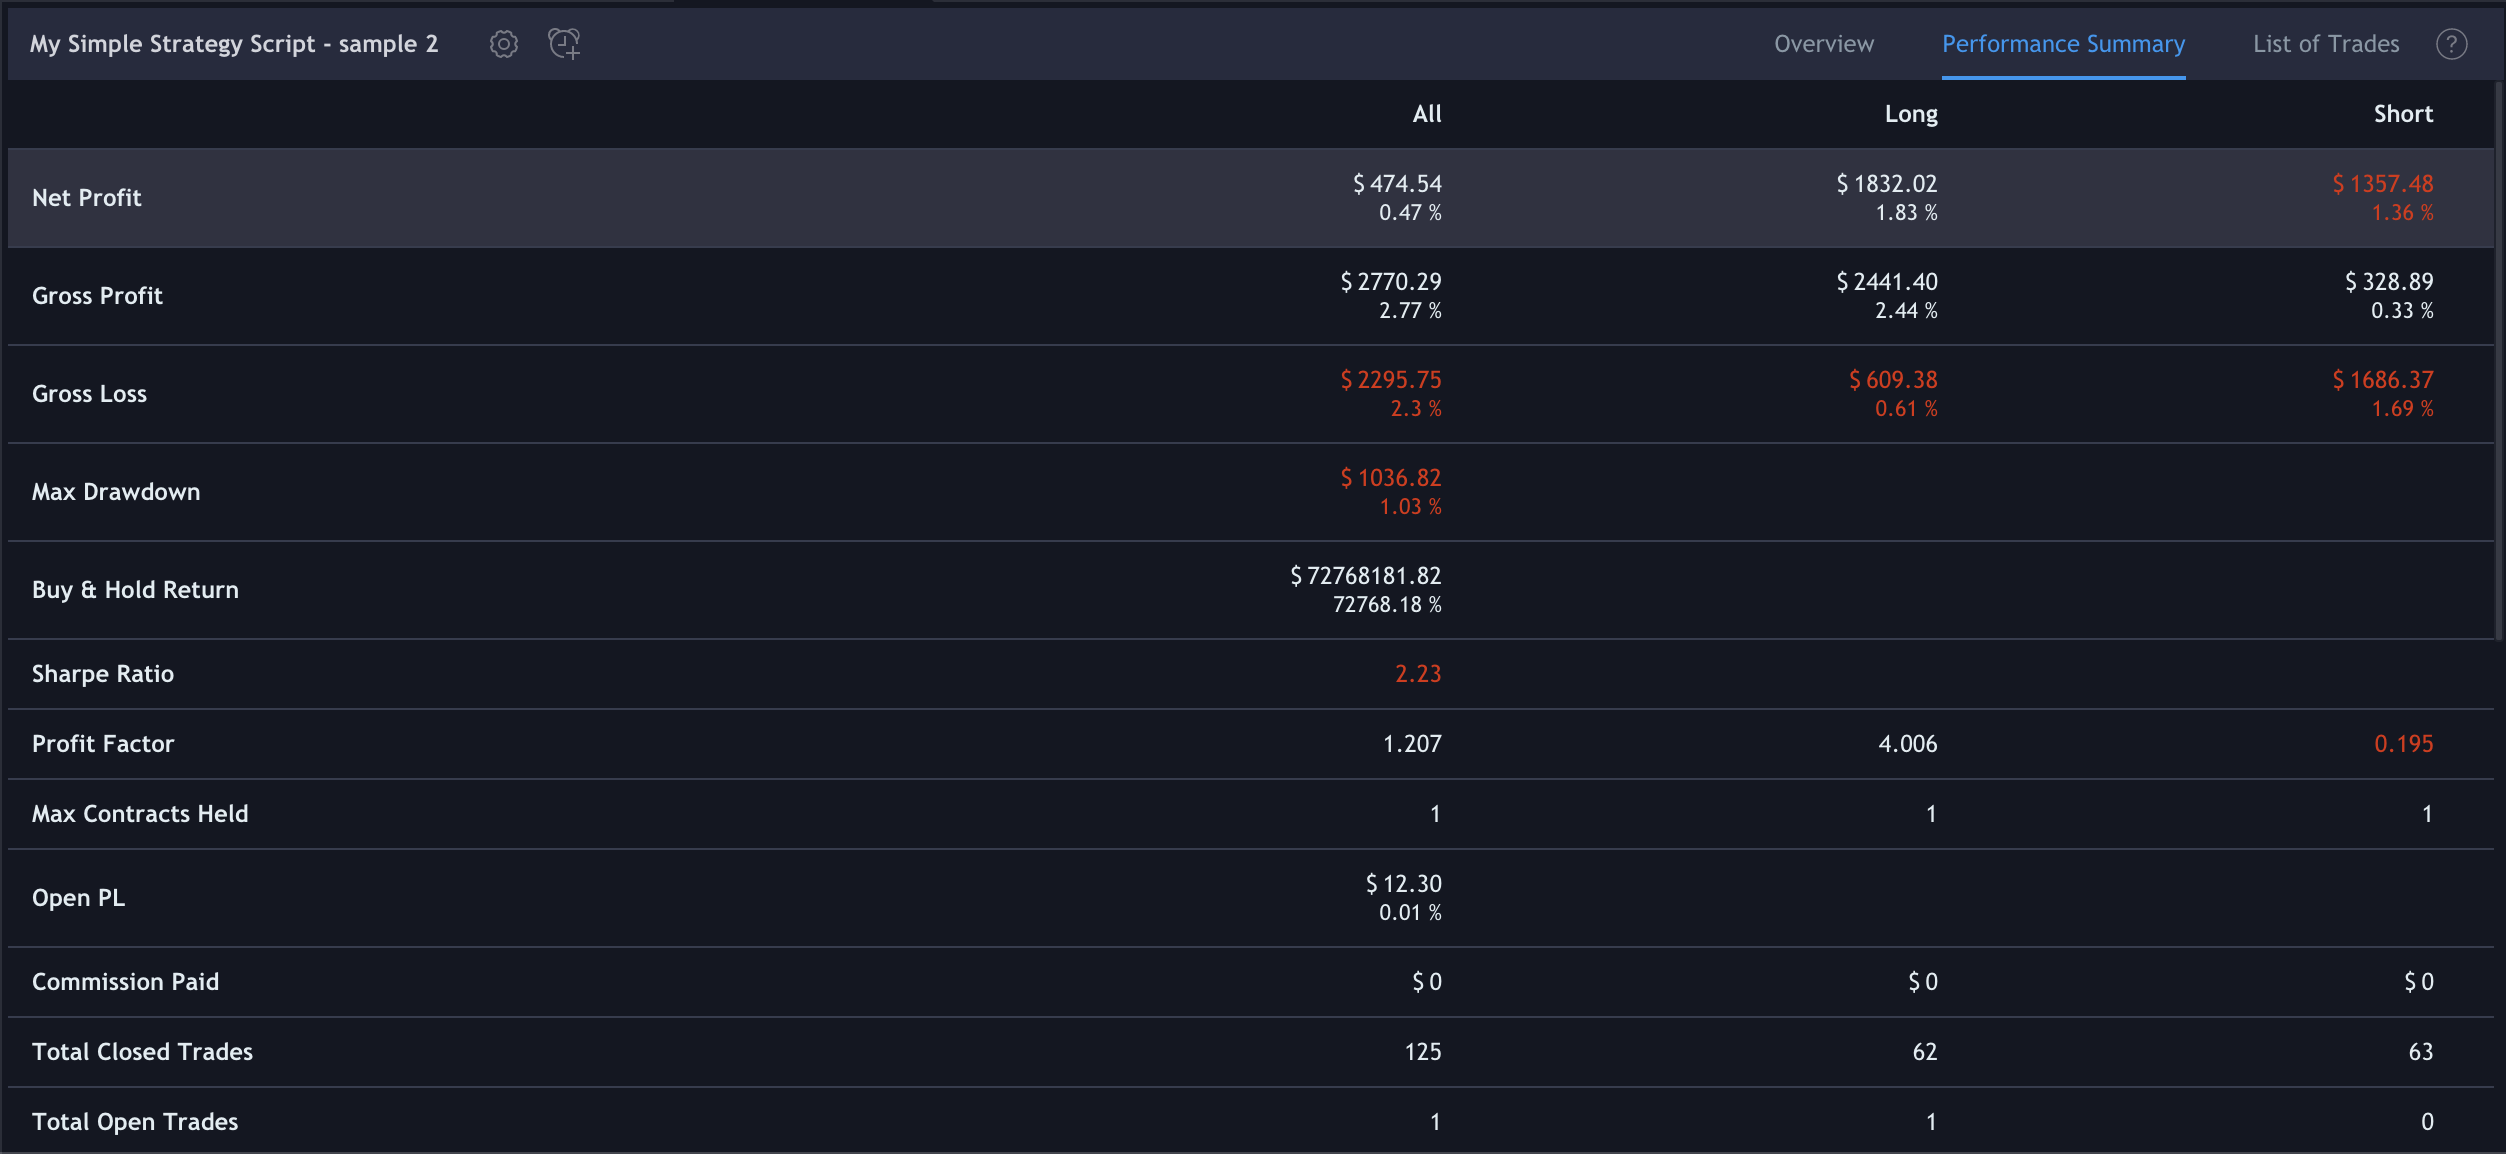
List of Trades