Getting started
Pine is a script language own of Tradingview for adding your indicators and backtesting your trades.
This is a summary of the pine language syntax: you can find,
the methods description in pine script reference
the complete documentation in pine script docs
and many many samples in PineCoders
Basics
There are some methods to load your data
//@version=4
//study("My Simple Sample Script") // in a chart space dedicated
//study("My Simple Sample Script", max_labels_count = 500) // in a chart space dedicated with a max label > 50, that it is the default
study("My Simple Sample Script", "", true) // in the main chart
It is important to remember that it is a script language:
it has a few methods
there are not matrixes or complex calculation, only the essential
Pine draws your indicators and data in the Tradingview charts and in the Data Window. So, it is important to understand which methods you have for debugging your code.
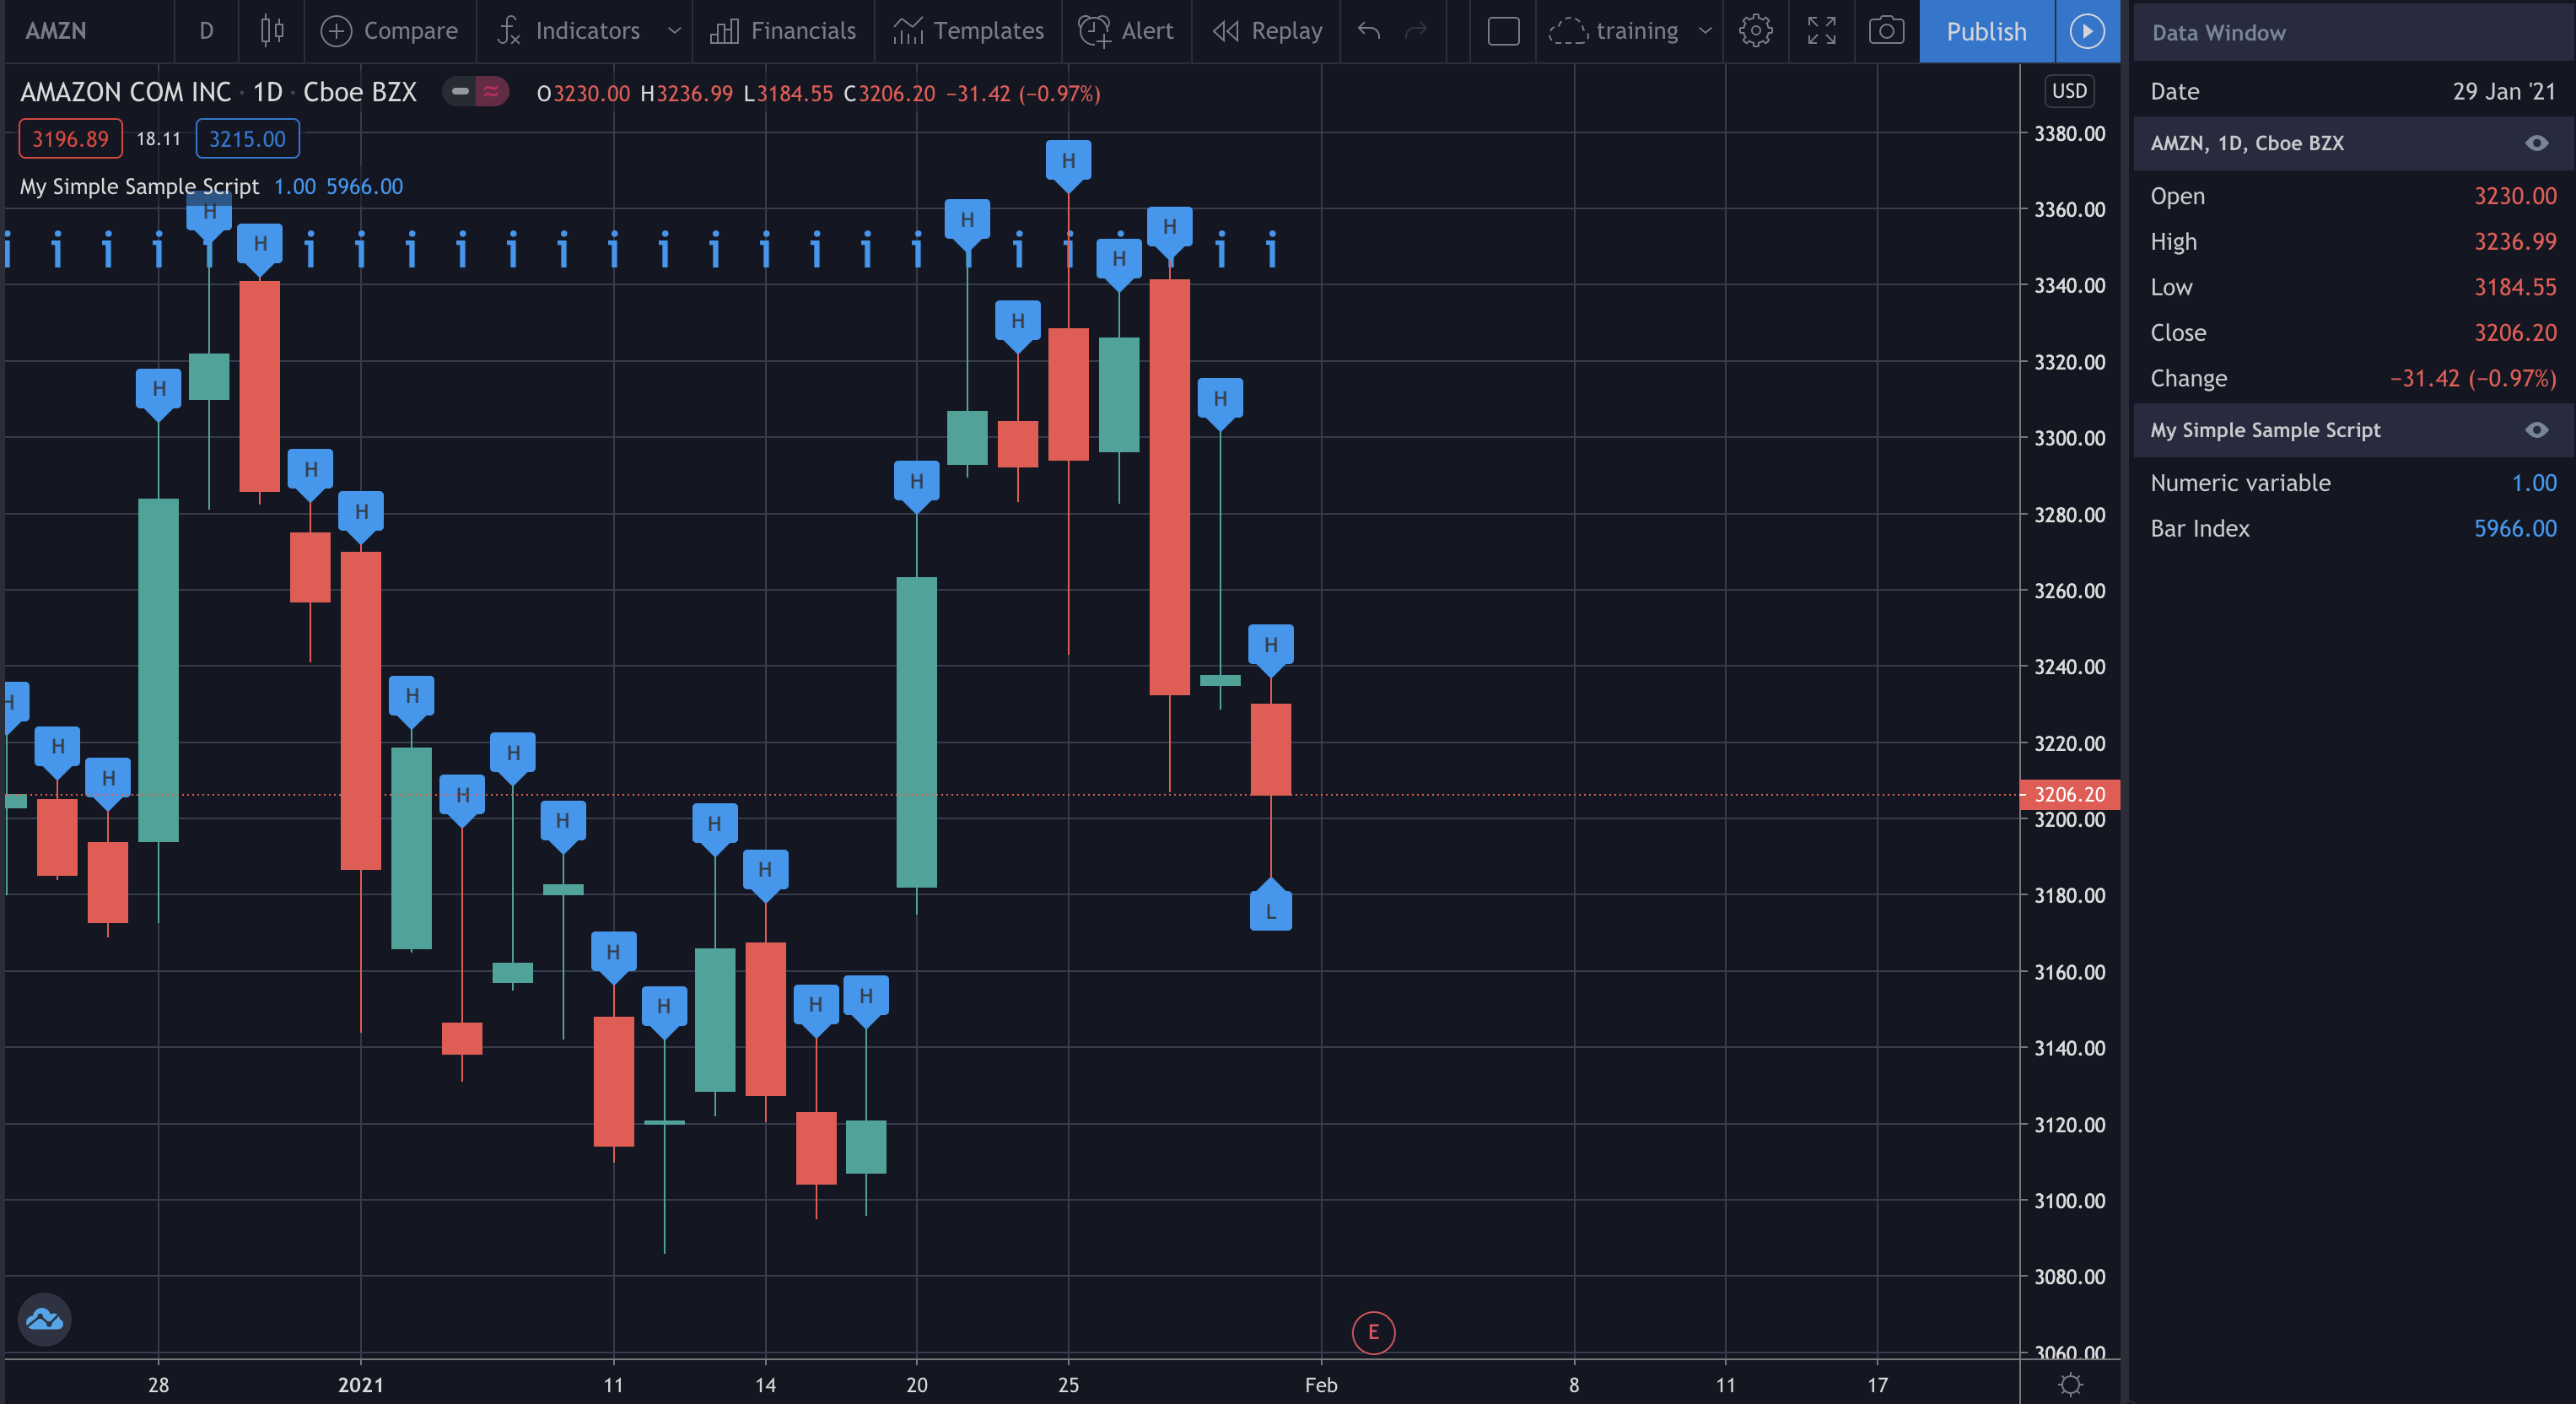
// initialization of a variable
my_numeric_variable = 1
my_string_variable = "H"

// where print something
plotchar(my_numeric_variable, "Numeric variable", "") // on the right, in Data Window
plotchar(bar_index, "Bar Index", "i", location = location.top) // on the right, in Data Window and on the main panel, in the chart space
label.new(bar_index, high, my_string_variable) // on each bar
if barstate.islast
    label.new(bar_index, low, "L", style = label.style_label_up) // only on the last bar
It is not possible to use
plotchar method on Data Window with a string value
plotchar and label.new methods in a function
plotchar method in a local scope like also a for loop
Arrays
Pine arrays are one-dimensional. All elements of an array are of the same type, which can be int, float, bool or color, always of series form.
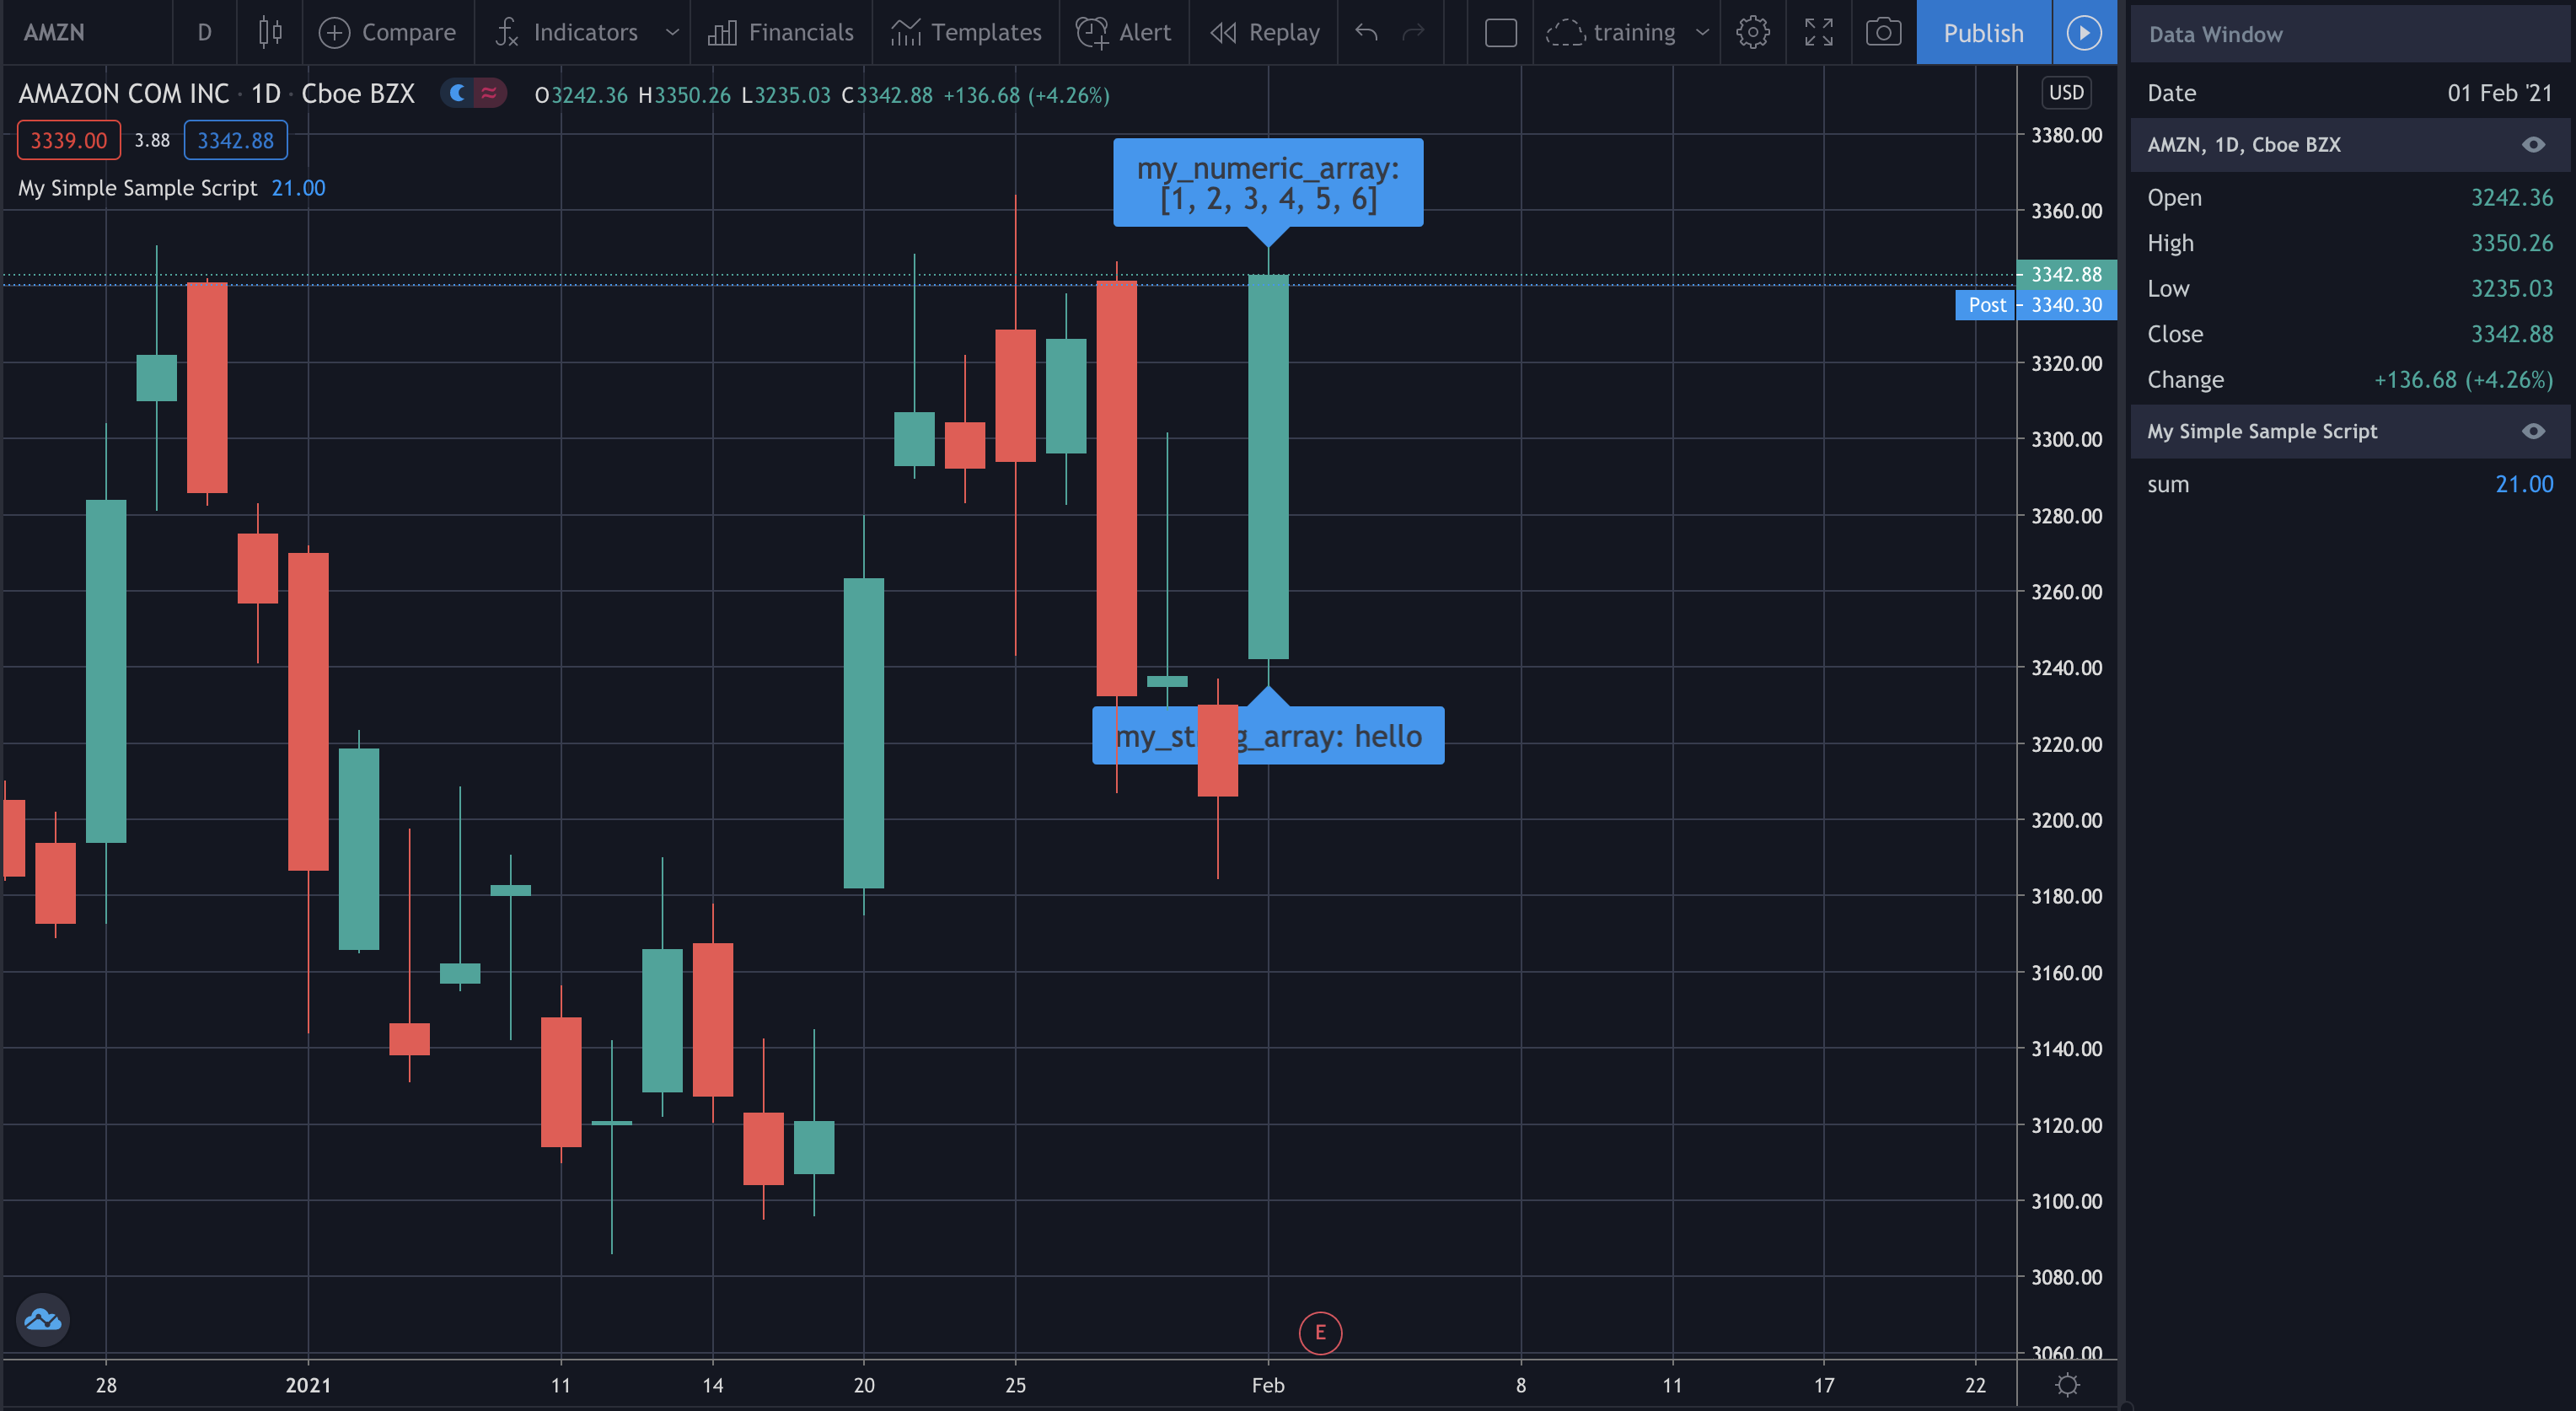
// initialization of a vector
my_numeric_array = array.new_float(0)
for i = 1 to 6
    array.push(my_numeric_array, i)
if barstate.islast // print
    label.new(bar_index, high, "my_numeric_array:\n" + tostring(my_numeric_array), style = label.style_label_down, size = size.large)

my_string_array = array.new_string(1, "hello")
array.concat(my_string_array, array.new_string(1, "world"))
array.concat(my_string_array, array.new_string(1, "!"))
if barstate.islast // print
    label.new(bar_index, low, "my_string_array: " + array.get(my_string_array, 0), style = label.style_label_up, size = size.large)

my_logic_array = array.new_bool(0)
array.push(my_logic_array, 0)
array.push(my_logic_array, 1)

// operations with arrays
sum = array.sum(my_numeric_array)
mean = array.avg(my_numeric_array)
median = array.median(my_numeric_array)
plotchar(sum, "sum", "")
Weighted average
performance = array.new_float(0)
array.push(performance, 3)
array.push(performance, 7)
array.push(performance,11)
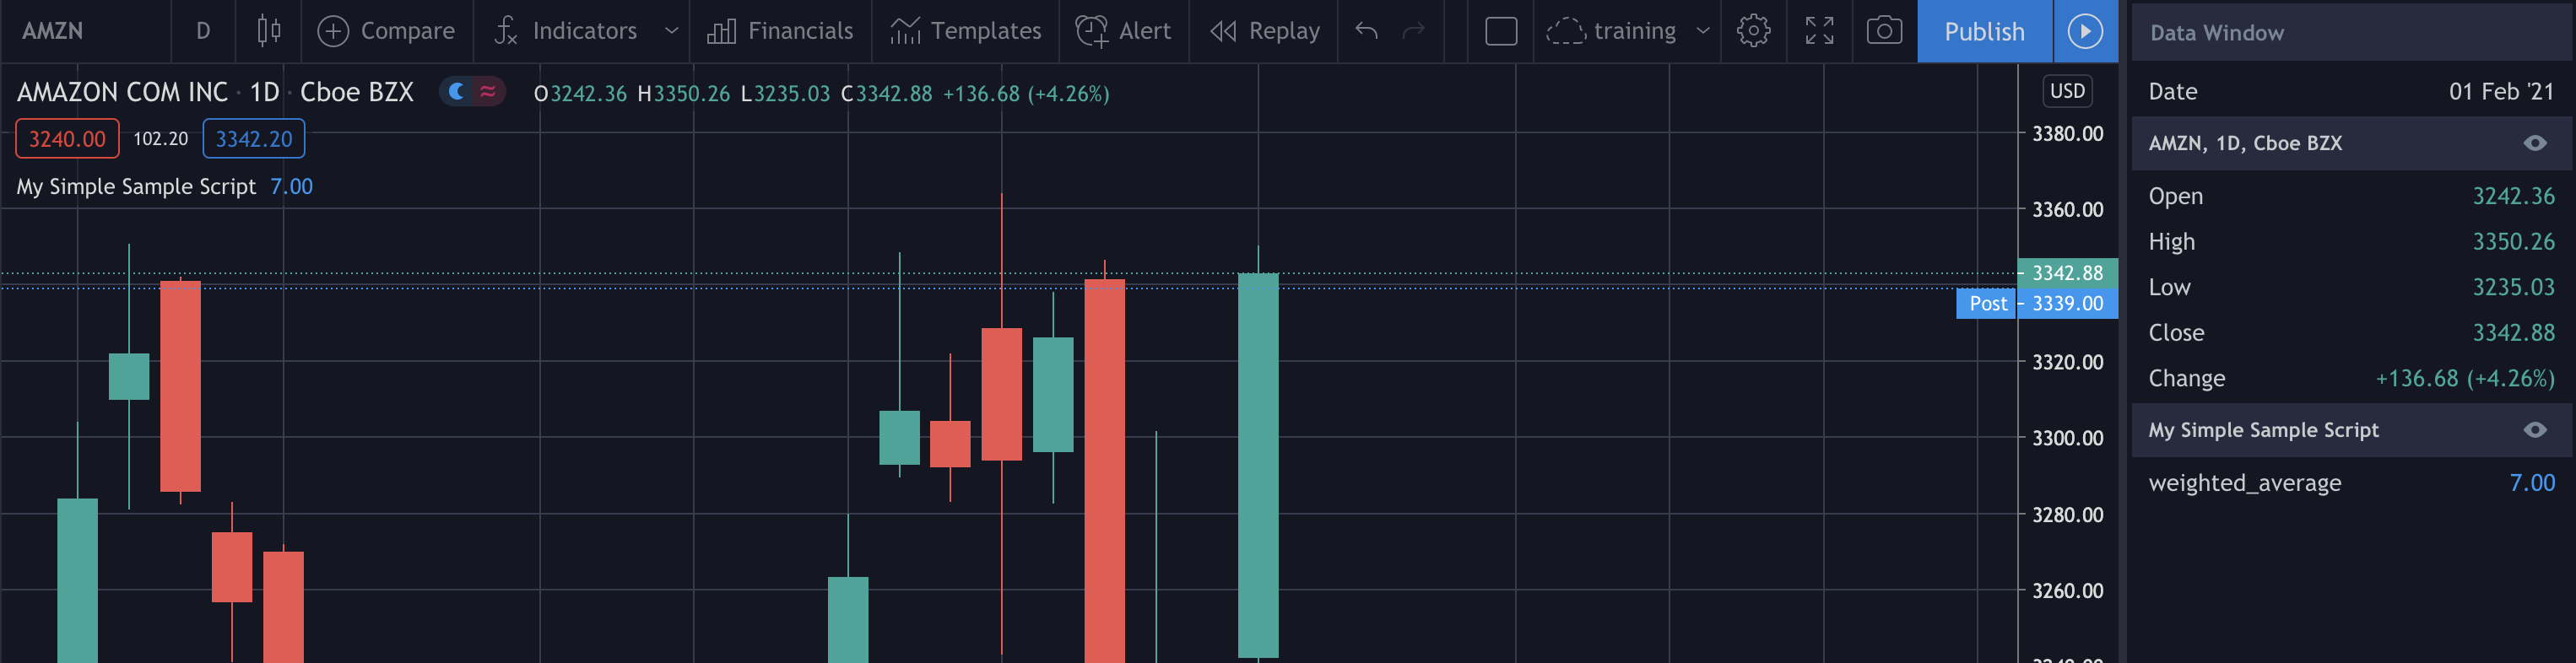
weight = array.new_float(0)
array.push(weight, .3)
array.push(weight, .4)
array.push(weight, .3)
weighted_average = array.get(performance, 0) * array.get(weight, 0) + array.get(performance, 1) * array.get(weight, 1) + array.get(performance, 2) * array.get(weight, 2)
plotchar(weighted_average, "weighted_average", "")
Functions
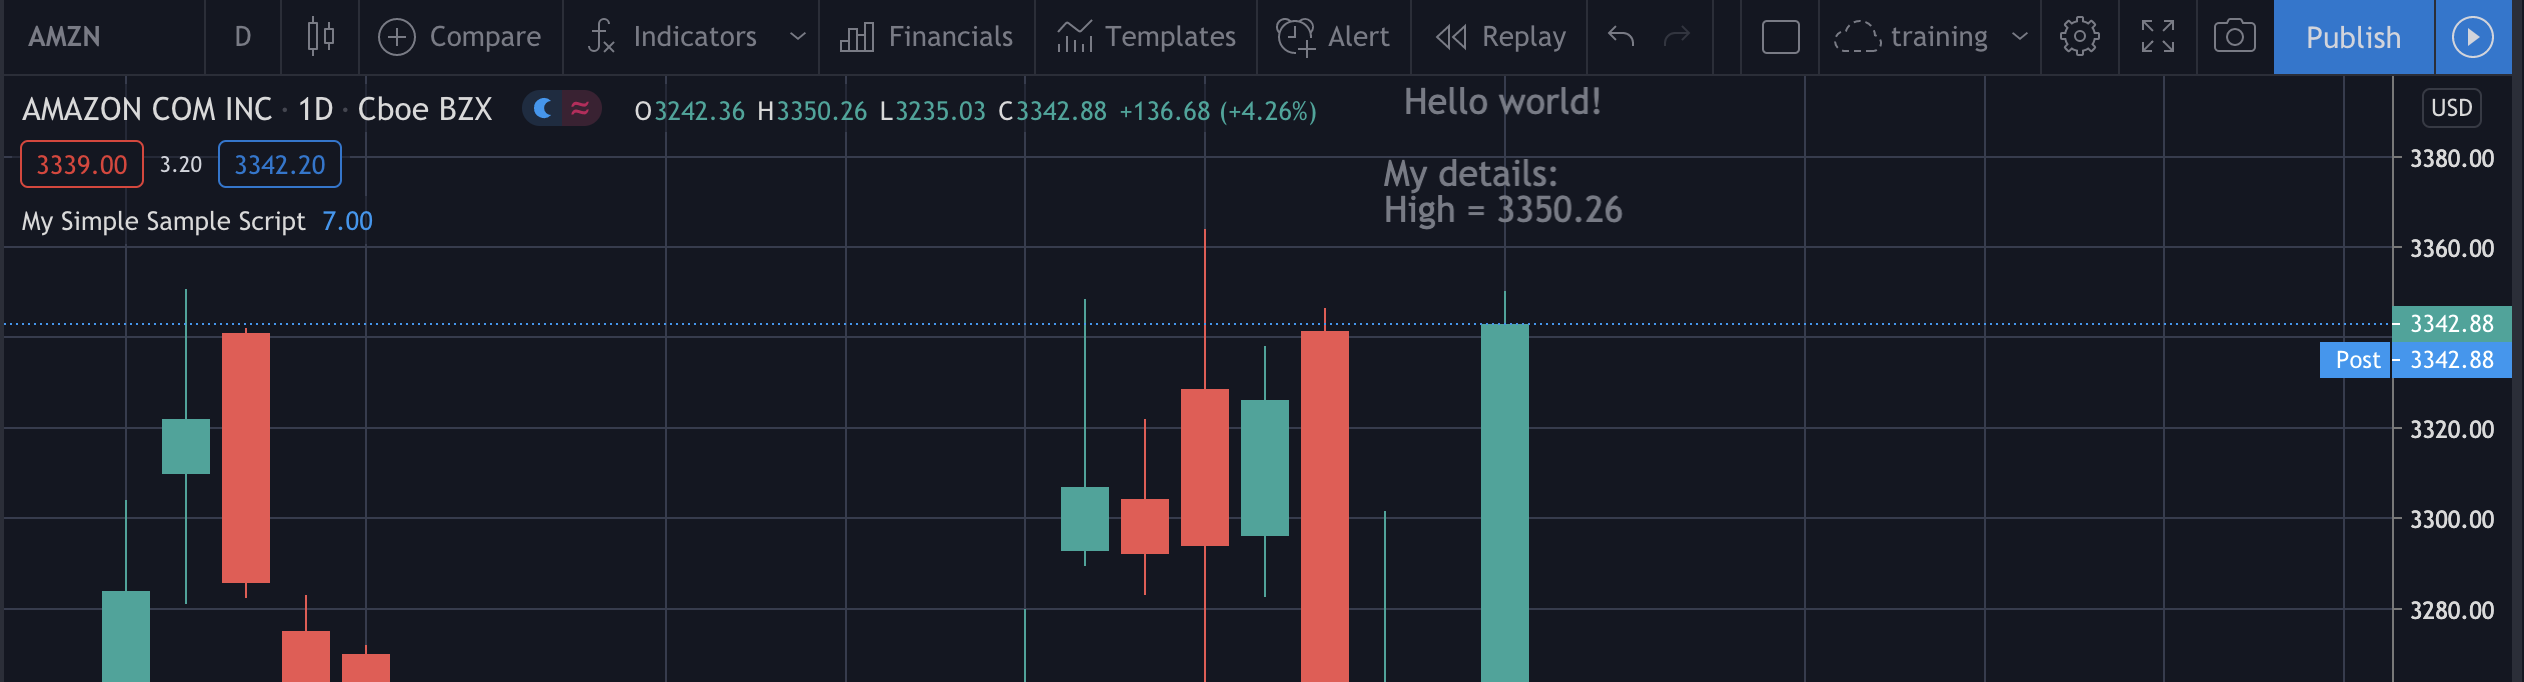
The functions could return something or not (see the docs for details). The first function named f_print, it returns nothing, only prints on the chart.
// prints on last bar, in the chart space
f_print(_text) =>
    // Create label on the first bar.
    var _label = label.new(bar_index, na, _text, xloc.bar_index, yloc.price, color(na), label.style_none, color.gray, size.large, text.align_left)
    // On next bars, update the label's x and y position, and the text it displays.
    label.set_xy(_label, bar_index, highest(10)[1])
    label.set_text(_label, _text)
f_print("My details:\nHigh = " + tostring(high))
f_print(my_string_variable + "ello world!\n\n\n")
The second function named multiply_performance_weight, it returns an array.
// portfolio performance
company = array.new_string(1, "AAPL")
array.concat(company, array.new_string(1, "NFLX"))
array.concat(company, array.new_string(1, "AMZN"))
multiply_performance_weight(_performance, _weight) =>
    _performance_weight = array.new_float(0)
    for i = 0 to array.size(_performance) - 1
        _one_of_performance_weight = array.get(_performance, i) * array.get(_weight, i)
        array.push(_performance_weight, _one_of_performance_weight)
    _performance_weight // return the array
And inner a for loop is not possible to use plotchar method, but only label.new method.
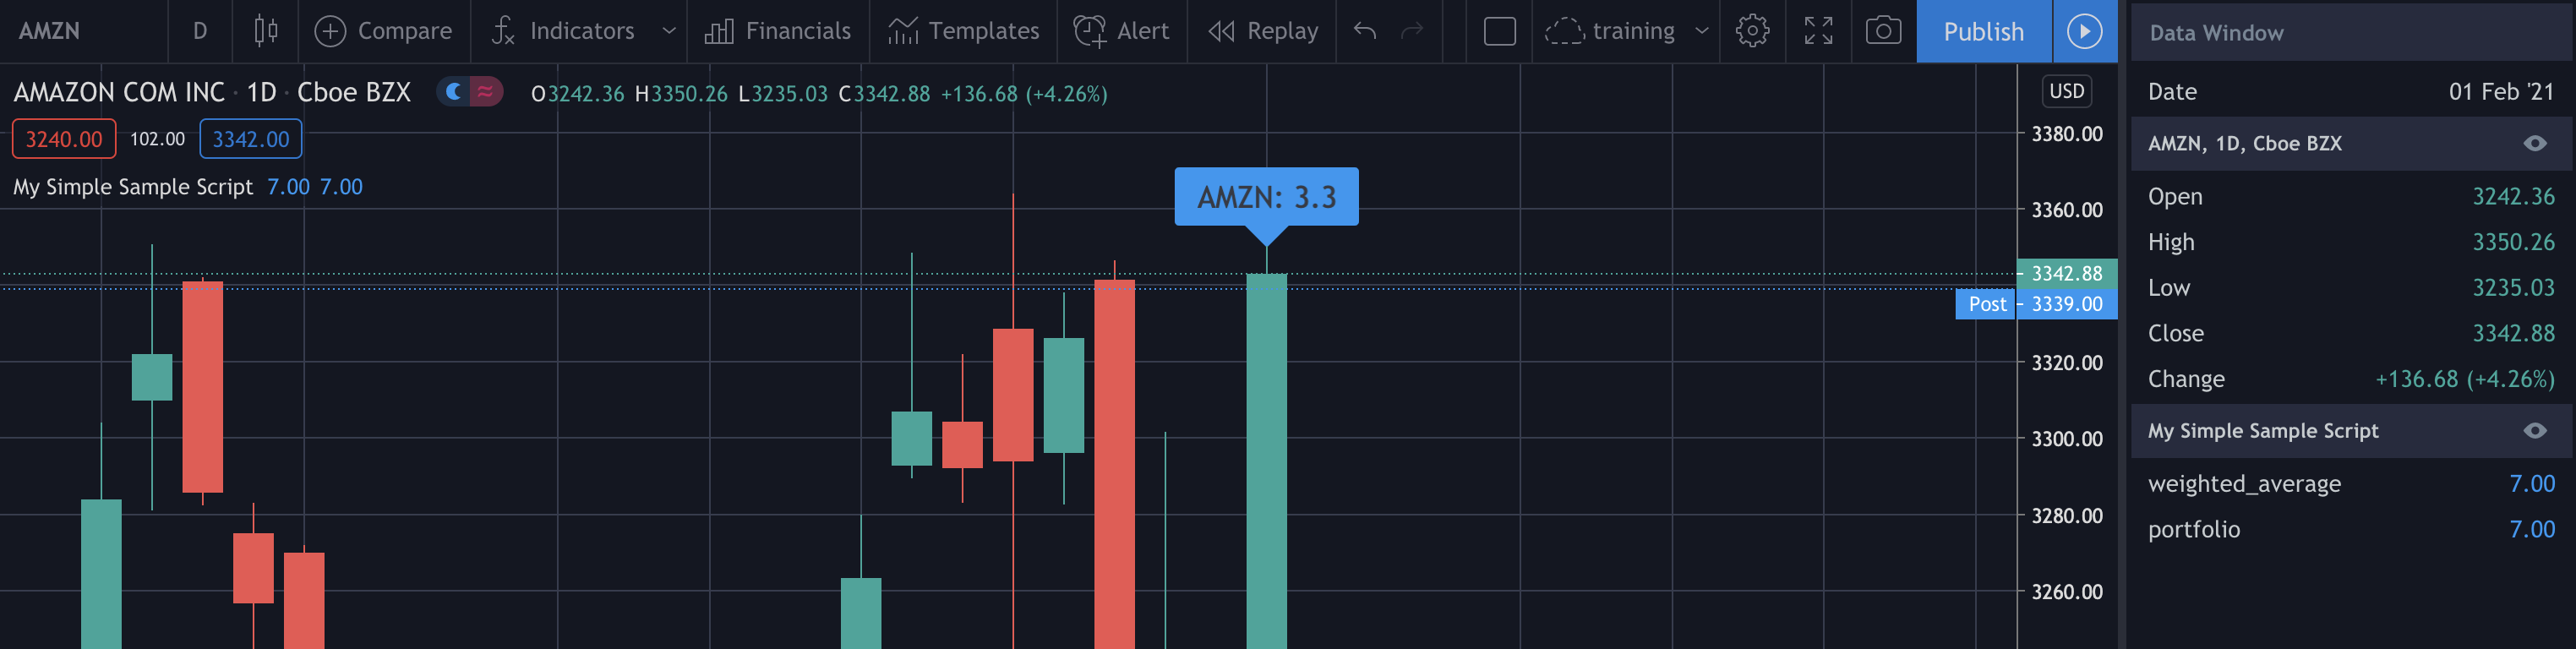
performance_weight = multiply_performance_weight(performance, weight)
weighted_average2 = array.sum(performance_weight)
for i = 0 to array.size(performance) - 1
    if barstate.islast // print
        label.new(bar_index, close, array.get(company, i) + ": " + tostring(array.get(performance_weight, i)), style = label.style_label_up, size = size.large)
plotchar(weighted_average2, "portfolio", "") // Cannot use 'plotchar' in local scope.