Graphics
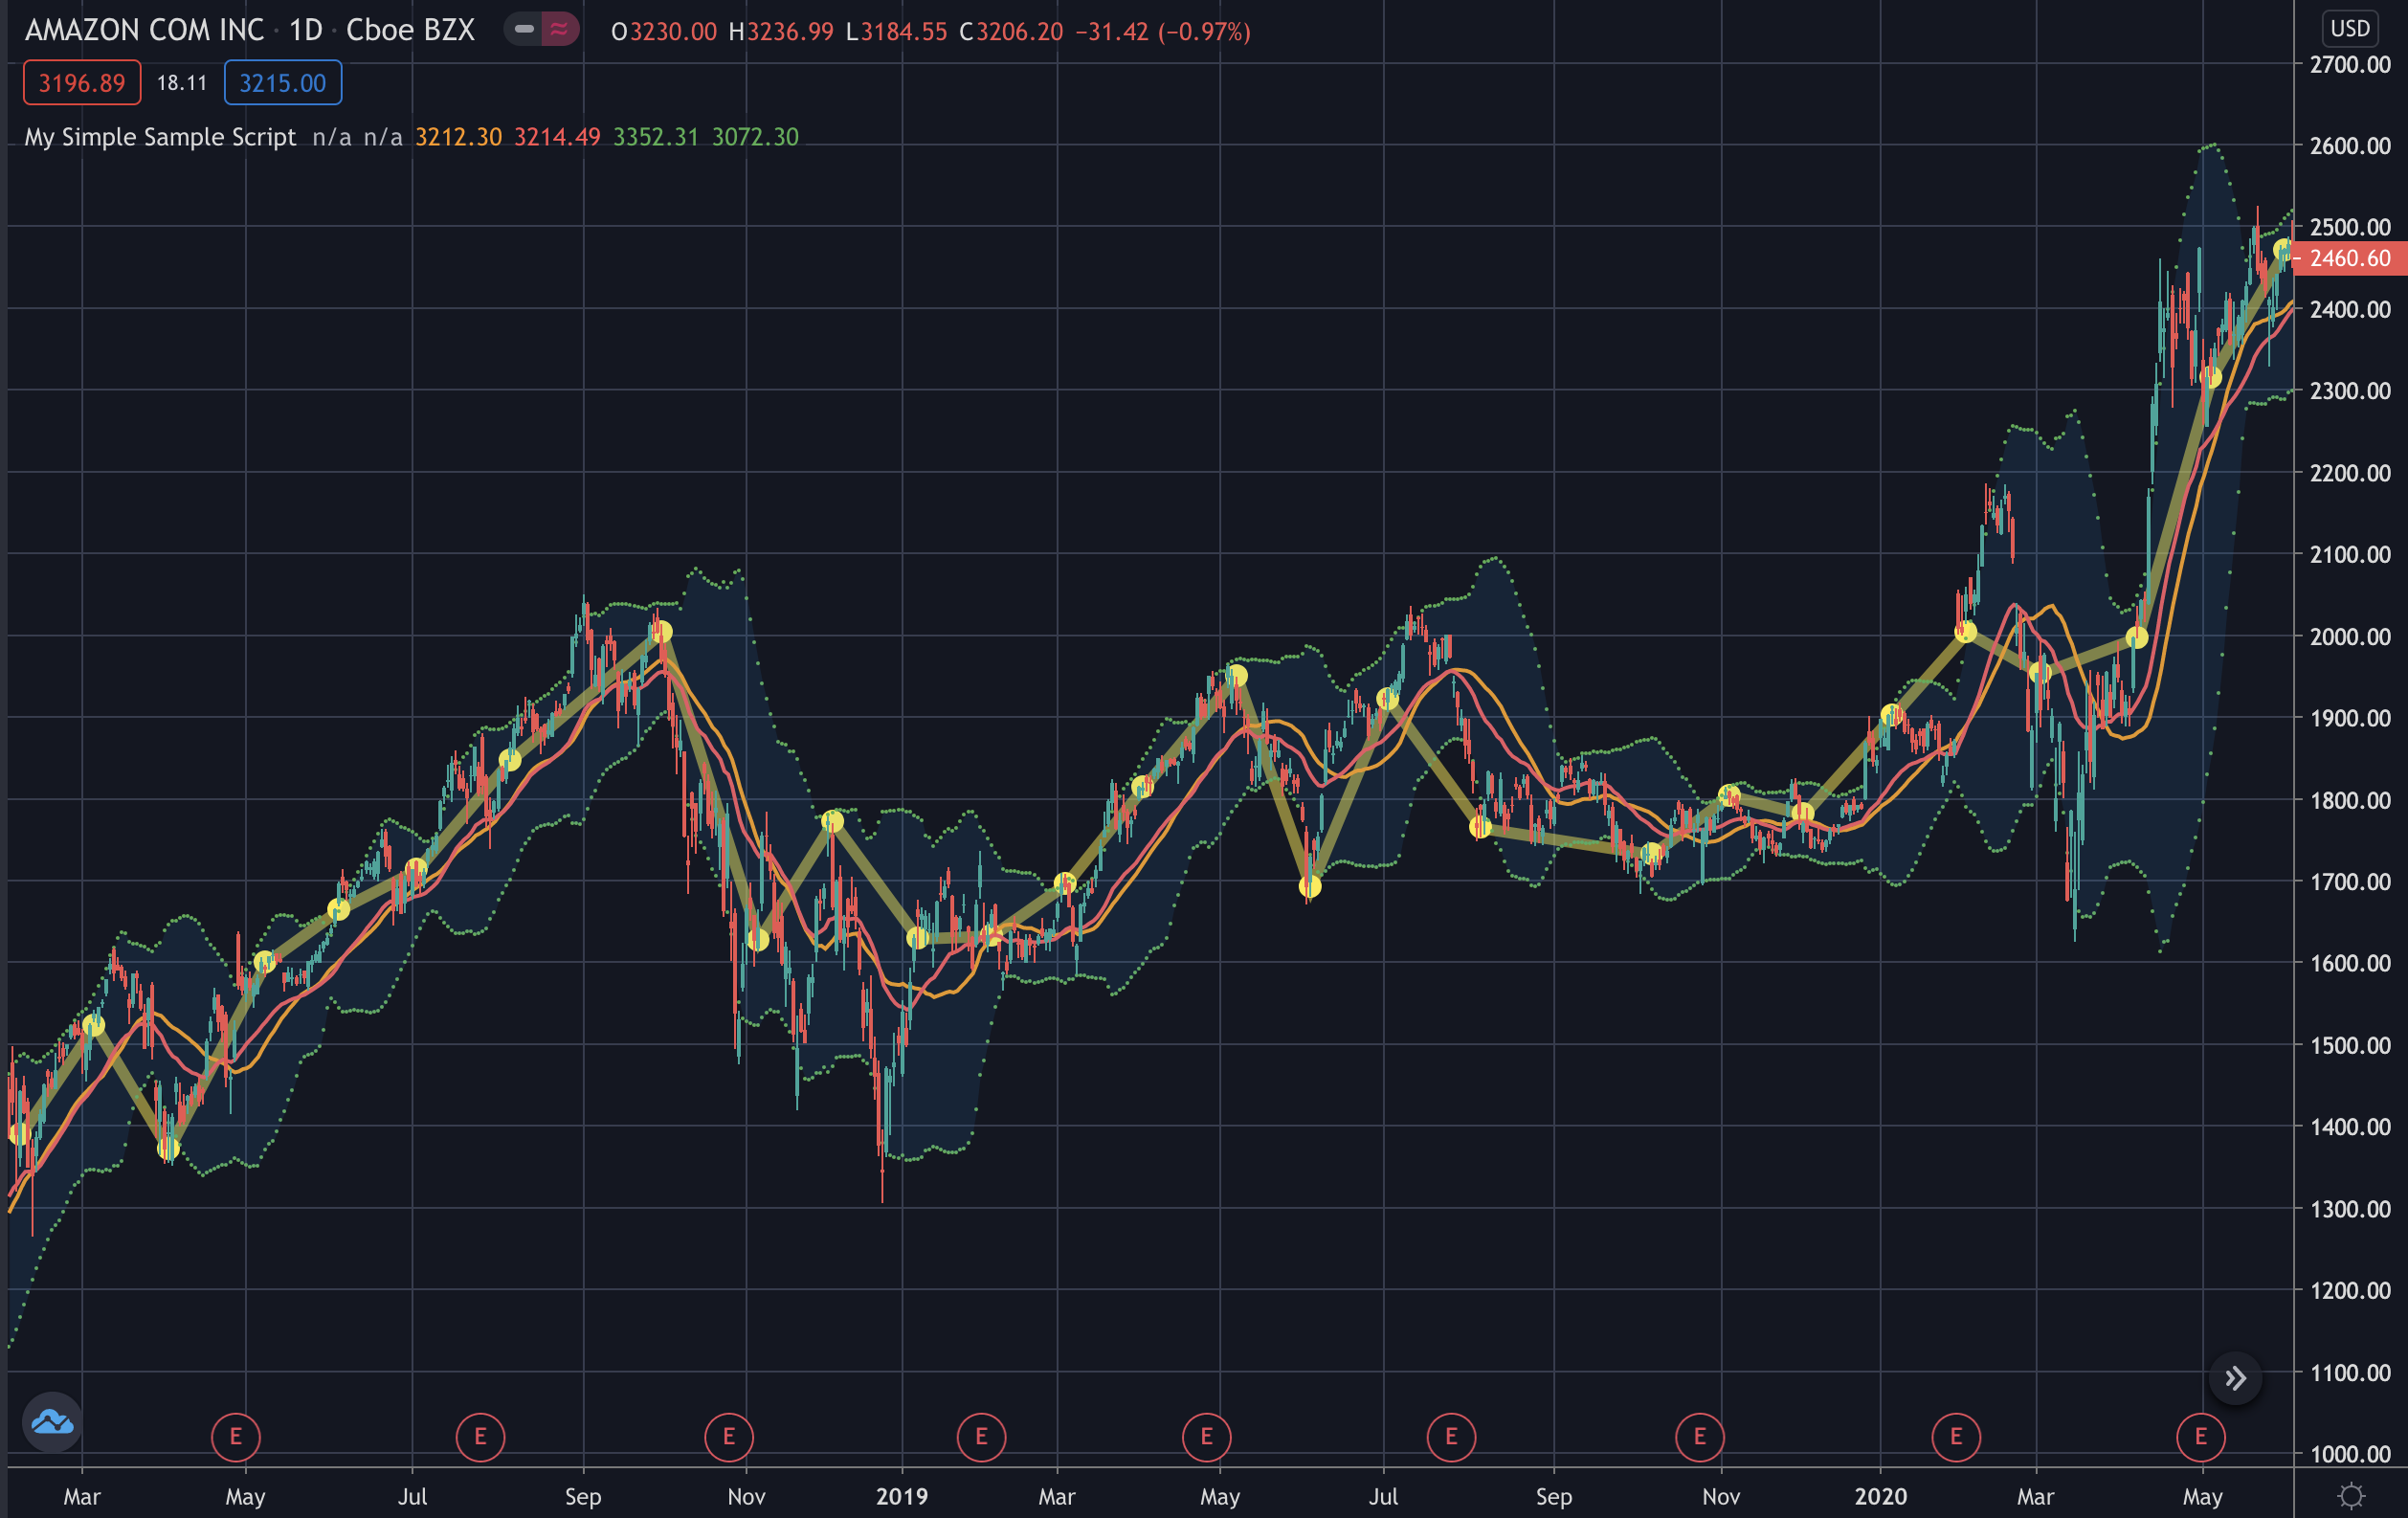
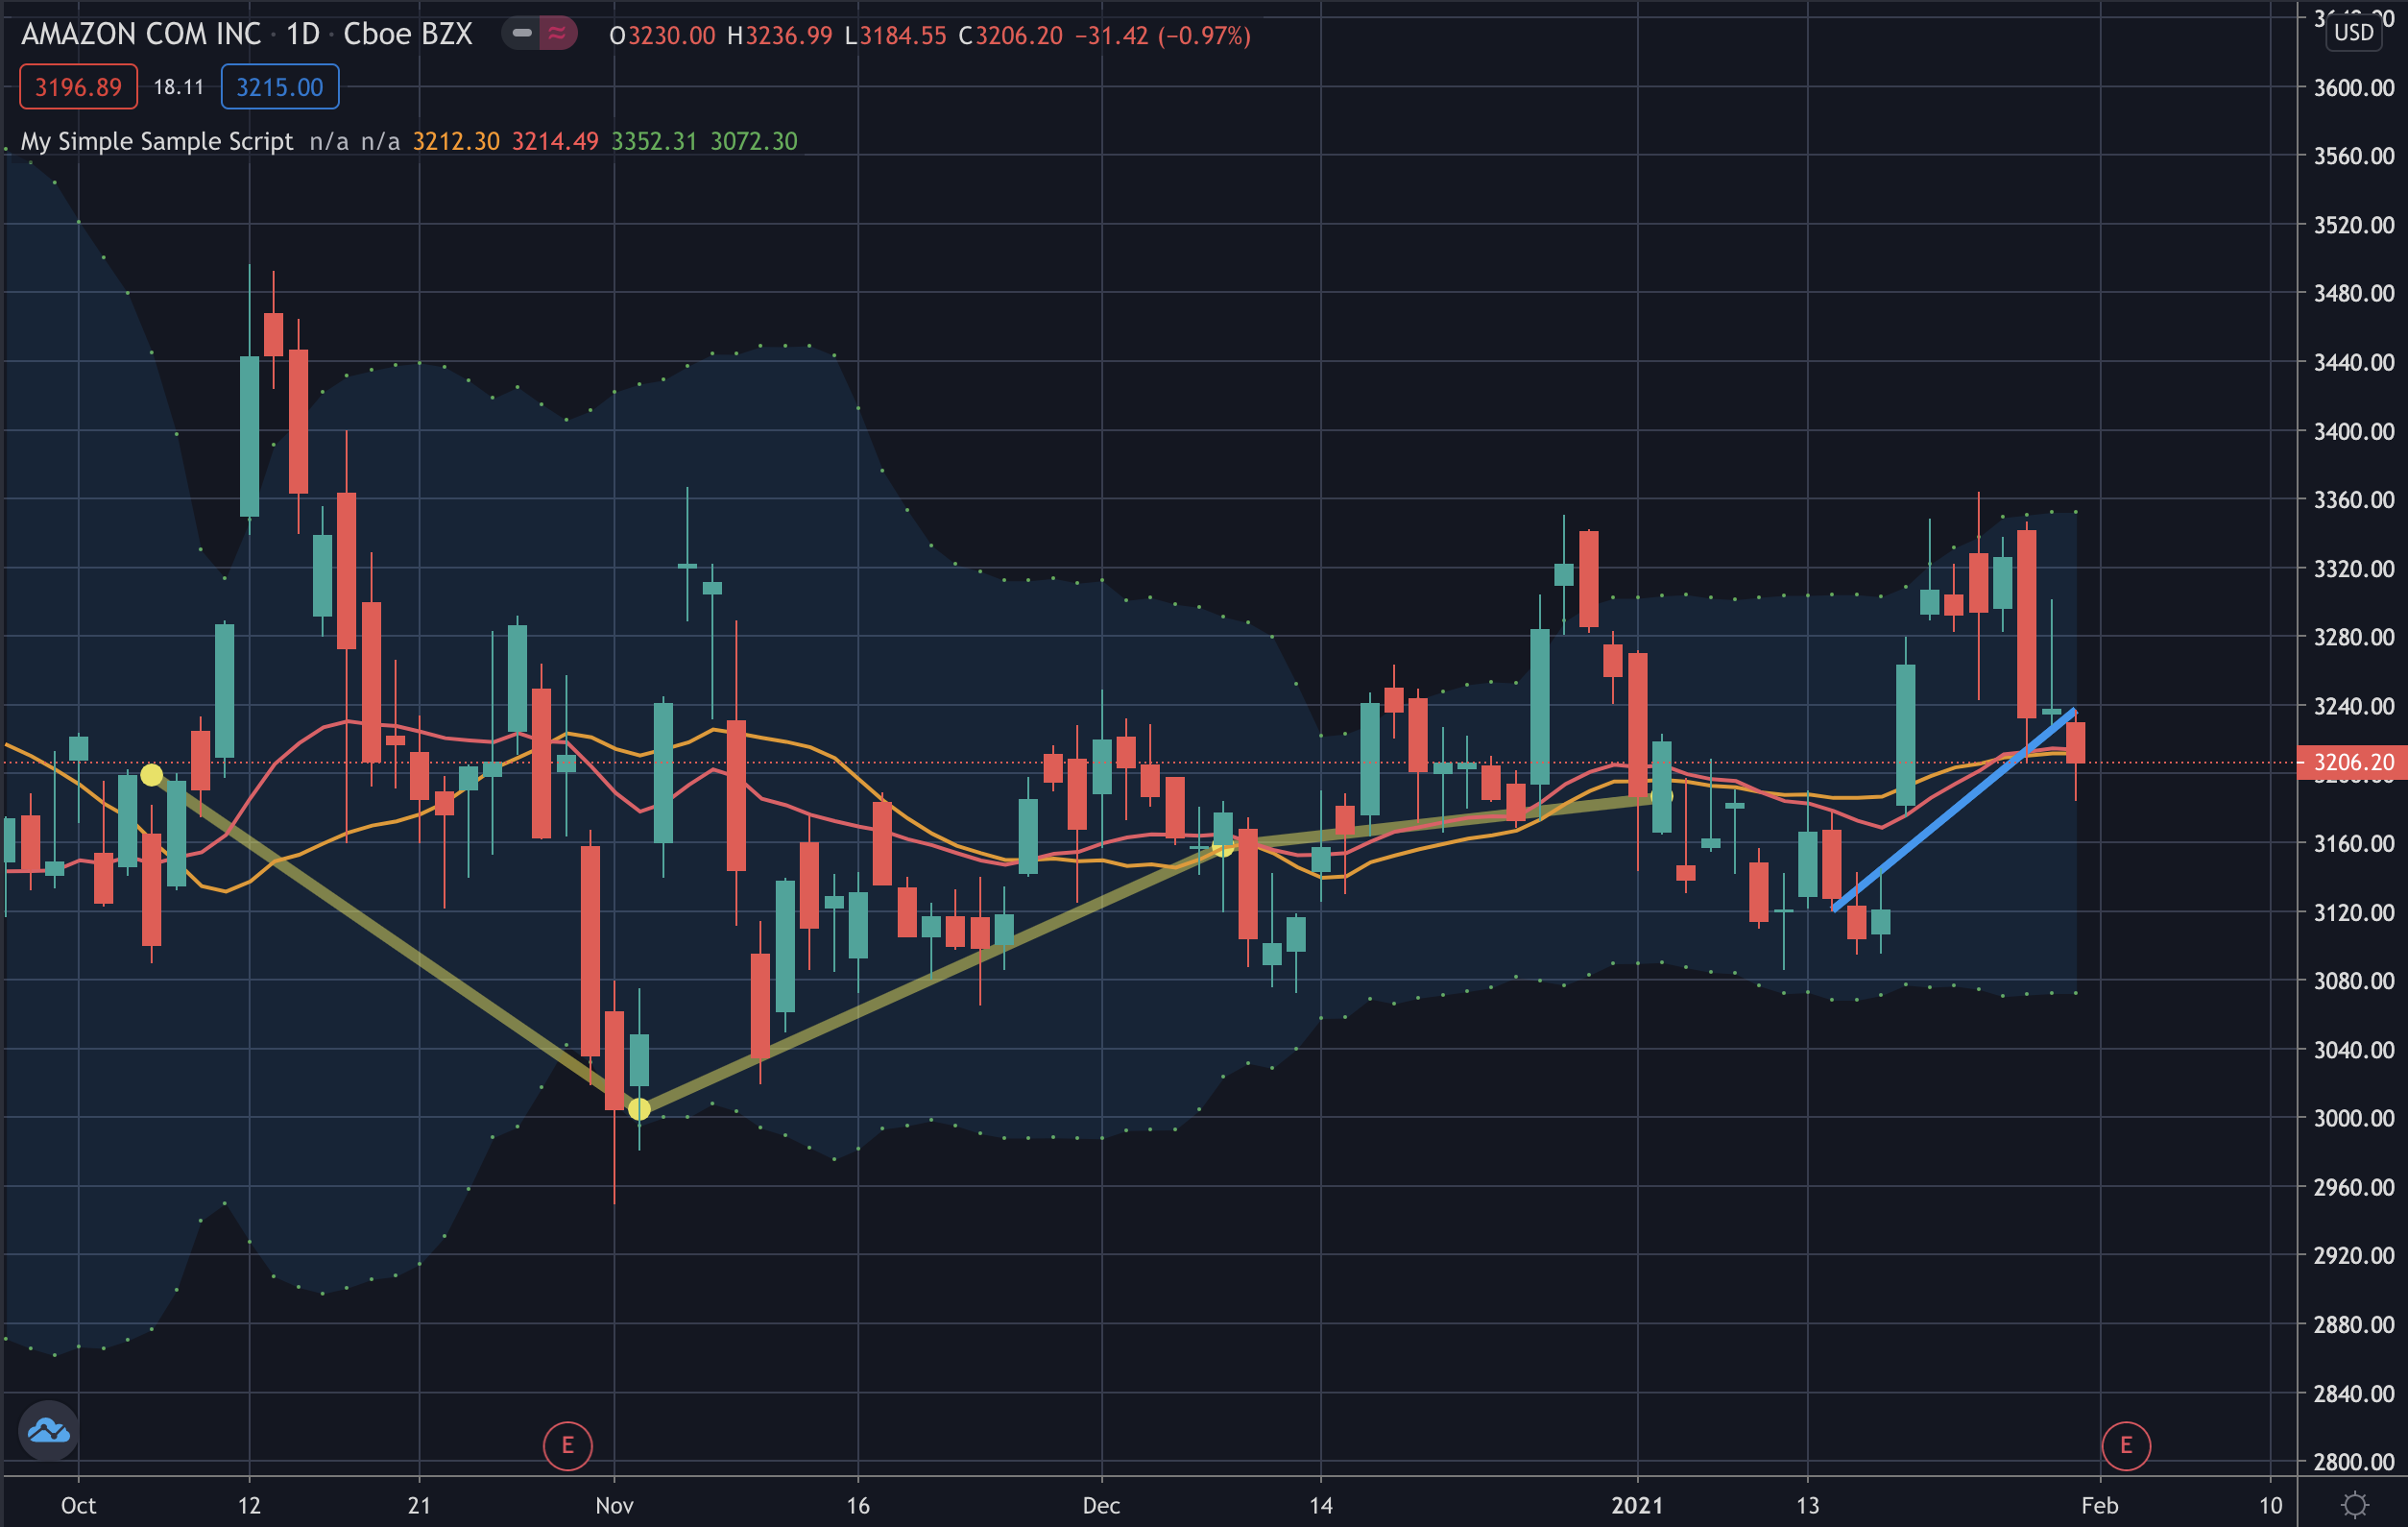
This is a sample for drawing objects with Pine. There are 2 principal methods for drawing, you can draw on
Lines
//@version=4
study("My Simple Sample Script", "", true) // the main chart
You can use the arrays pre loaded for you, like close (values of the closes), and modify them loading only the values that you want
// monthly points - the first Monday of each month
custom = array.new_float(1)
if dayofmonth <= 7 and dayofweek == dayofweek.monday
    array.set(custom, 0, close)
else
    array.set(custom, 0, na)
customPreviousClose = array.get(custom, 0)[1]
plot(customPreviousClose, "customPreviousClose", color.yellow, 6, plot.style_circles)
plot(customPreviousClose, "customPreviousClose", color.yellow, 6, plot.style_line, transp = 50)
And you can add many many indicators in a few code lines
// moving average
sma25 = sma(close, 25)
ema25 = ema(close, 25)
plot(sma25, "sma 25", color.orange, 2)
plot(ema25, "ema 25", color.red, 2)

// bollinger bands
ma = sma25
dev = 2 * stdev(close, 25)
upper = ma + dev
lower = ma - dev
p1 = plot(upper, color=color.green, linewidth=1, style=plot.style_circles)
p2 = plot(lower, color=color.green, linewidth=1, style=plot.style_circles)
fill(p1, p2)
It is possible to draw line from one point to another point, by bar_index or time
// line by index
i = line.new(bar_index, high, bar_index[10], low[10], width = 4)
line.delete(i[1])

// line by time
t = line.new(time, high, time[10], low[10], xloc.bar_time, width = 4)
line.delete(t[1])
Columns
It is possible to simulate Volume indicator on the main chart with specific parameters
on the study method
adding a workaround that it is the plot of high line
//@version=4
study("My Simple Volume Script", "", true, format.volume, 0, scale.none)

//Get volume for current bar and multiply with vwap
vInverse = volume * vwap
plot(series=vInverse, title="Volume", style=plot.style_columns, color=close >= open ? color.green : color.red, transp=50)

//Plot high line to scale down the columns
highLine = input(1000, "High Line", minval = 2, step = 100)
limit = highest(vInverse, highLine)
scaleFactor = 100 / input(20, "% of vertical space used", step = 10, maxval = 100)
plot(limit * scaleFactor, "Historical High", color.black)
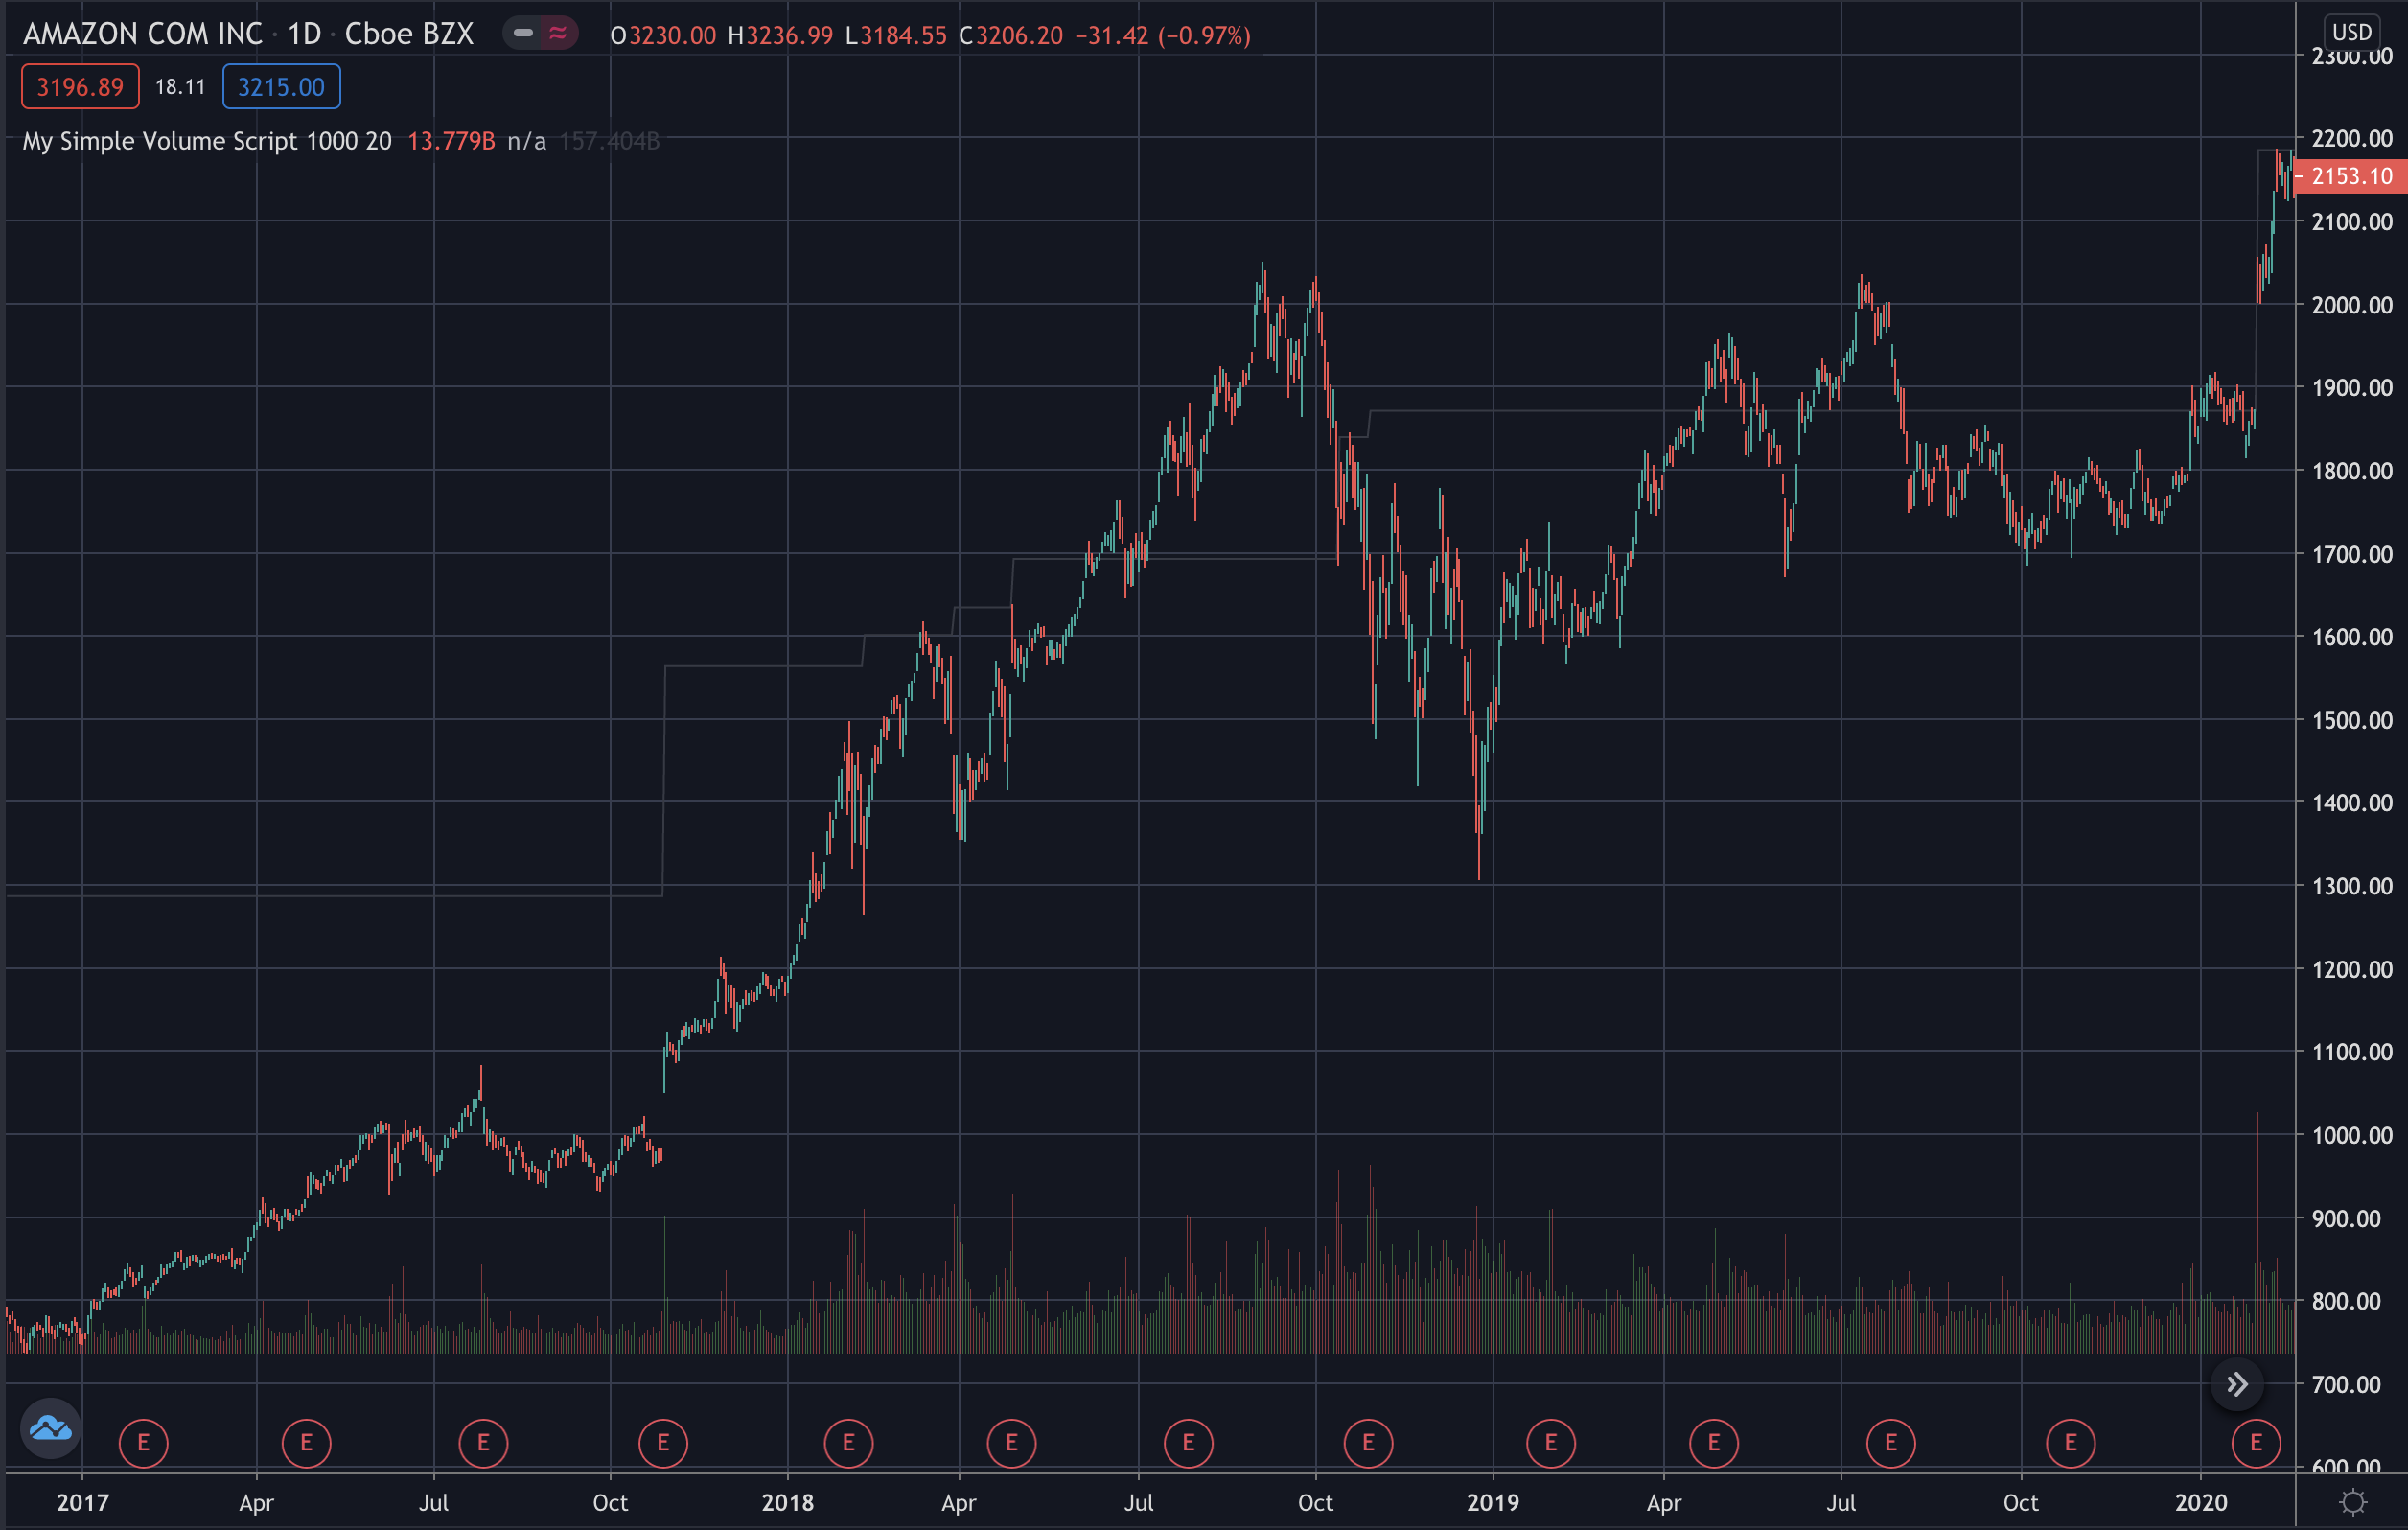
And you can also add SMA indicator over the Volume indicator
//Make the moving average user configurable
showMA = input(true)
plot(showMA ? sma(vInverse,20) : na, title="SMA", style=plot.style_area, color=color.white, transp=80)
The second script has also some inputs that you can manage the values by Settings symbol > Input.
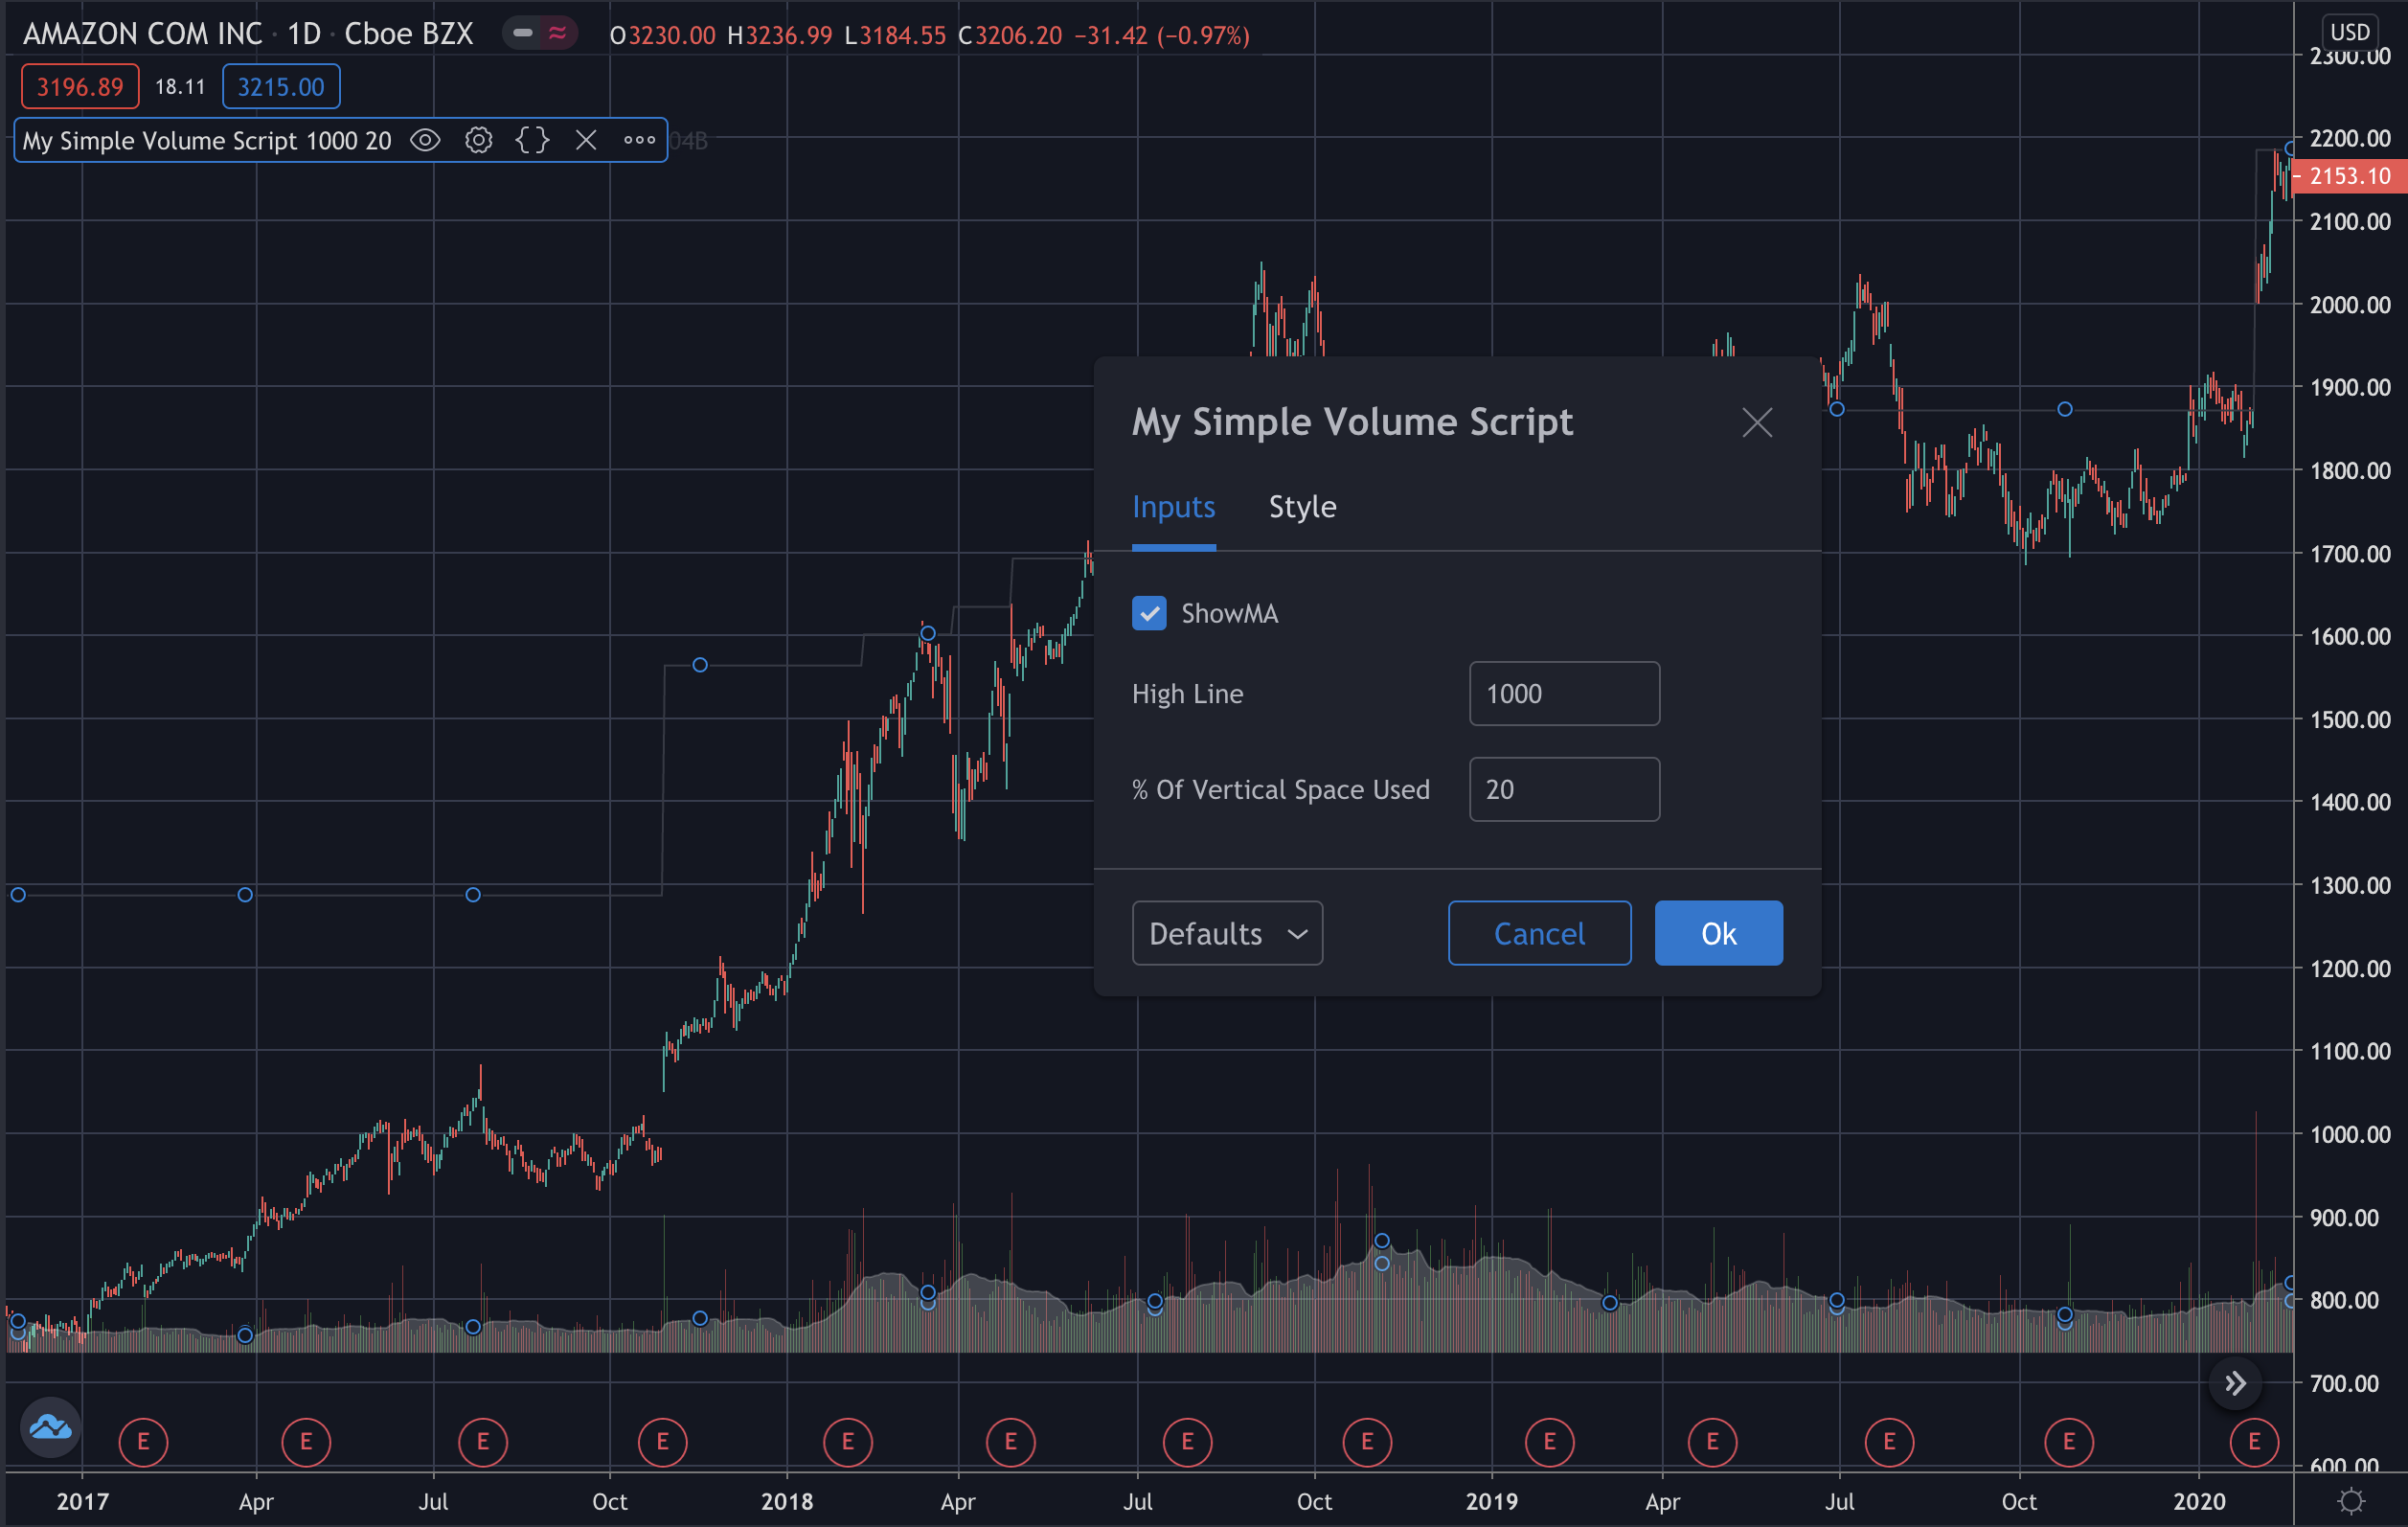
And you can change all colors by Settings symbol > Style.
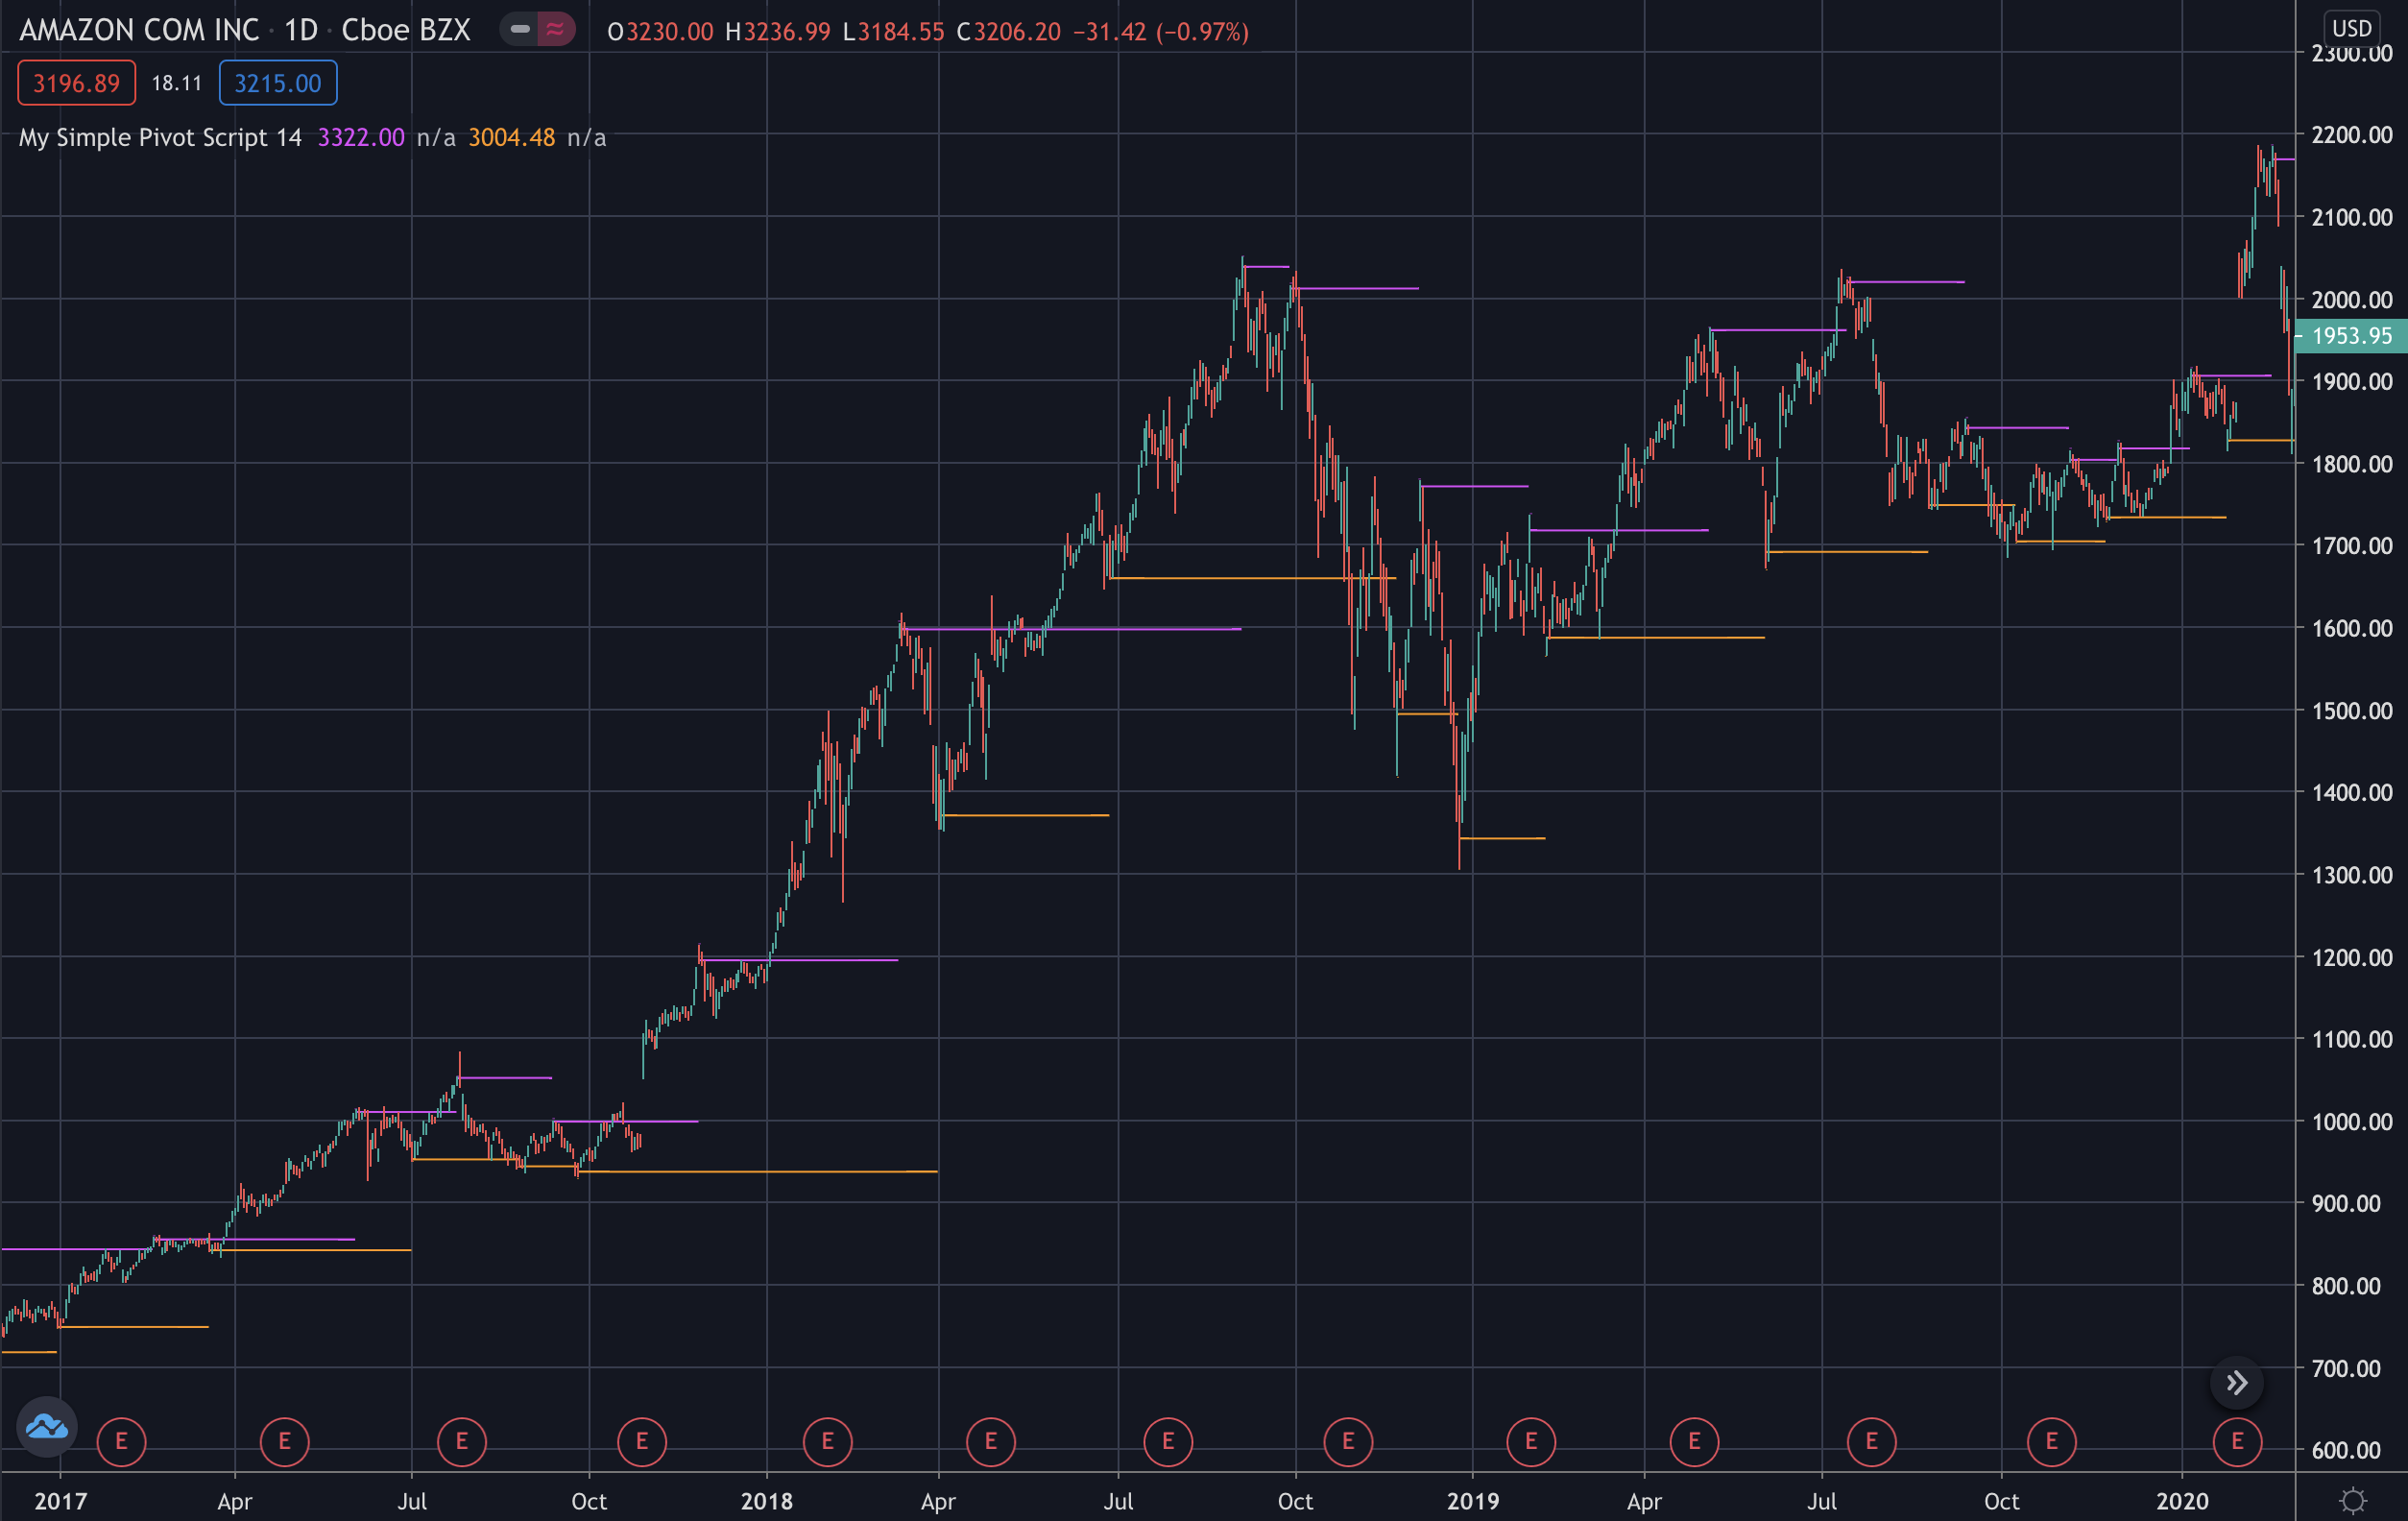
Points
There are many ready-made methods for you like pivot points.
//@version=4
study("My Simple Pivot Script", "", true)
In that sample you can decide if which plots show by input methods.
legs = input(14)
showPivotHigh = input(true)
showPivotLow = input(true)
And it is used a function, for reusing the code in two points.
pivot_points(pi, legs) =>
    newPi = not na(pi)
    var float ci = na
    if newPi
        ci := close[legs]
    [pi, newPi, ci]

[pHi, newPHi, cHi] = pivot_points(pivothigh(close, legs, legs), legs)
plot(showPivotHigh ? cHi : na, "", newPHi ? na : color.fuchsia, offset = - legs)
plotchar(showPivotHigh ? pHi : na, "pHi", "▼", location.top, color.fuchsia, offset = - legs)

[pLi, newPLi, cLi] = pivot_points(pivotlow(close, legs, legs), legs)
plot(showPivotLow ? cLi: na, "", newPLi ? na : color.orange, offset = - legs)
plotchar(showPivotLow ? pLi: na, "pLi", "▲", location.bottom, color.orange, offset = - legs)